Figures & data
Figure 1 Construction and identification of the CDX model of ccRCC sunitinib resistance. (A) Flow chart of ccRCC sunitinib-resistance model construction. (B) The curve of tumor volume with time in the control group, the CDX1-Su group, and the CDX3-Su group. (C) The half inhibitory concentration (IC50) of sunitinib on tumor cells in the control and CDX3-Su groups.
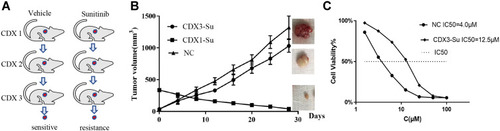
Figure 2 Identification of genes that were differentially expressed in drug-resistant tissues and the relatively sensitive tissues. (A) The volcano map reflecting the differentially expressed genes. Red color represents upregulated genes, while the blue color represents downregulated genes. The cutoff threshold was |logFC|>2.0 and adj. P < 0.05. (B) The histogram depicts that, among the genes with differential expression, there were 646 upregulated genes and 465 downregulated genes.
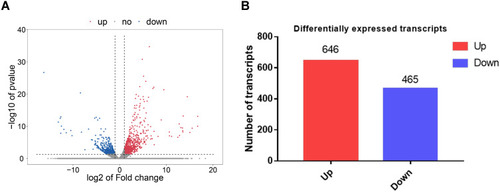
Figure 3 PPI network diagram of differentially expressed genes, as well as GO and KEGG analysis. (A) The PPI network diagram is composed of 613 genes and is visualized by Cytoscape. The interaction score > 0.4. (B) GO enrichment analysis results of genes in the PPI network. (C) KEGG analysis results of genes in the PPI network.
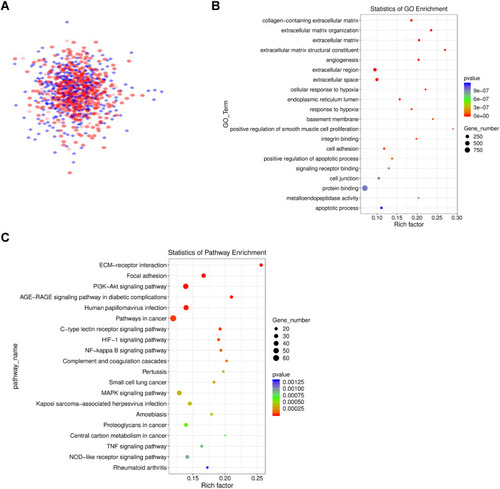
Figure 4 Modular analysis of PPI network (A) Module 1 contains 23 genes. (B) Module 3 contains 17 genes. (C) GO and KEGG analysis of genes in Module 1. (D) GO and KEGG analysis of genes in Module 3.
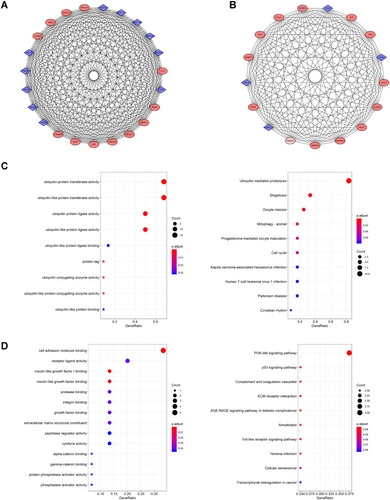
Figure 5 Hub gene analysis of PPI network (A) The top ten genes calculated by the MCC algorithm, the darker the color, the higher the ranking. (B) GO enrichment results of hub genes. (C) KEGG analysis result of Hub genes.
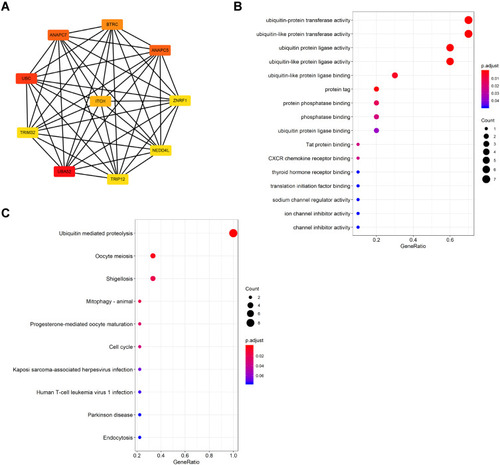
Figure 6 TCGA database was used to analyze the difference mRNA expression of hub genes between ccRCC and adjacent tissues.
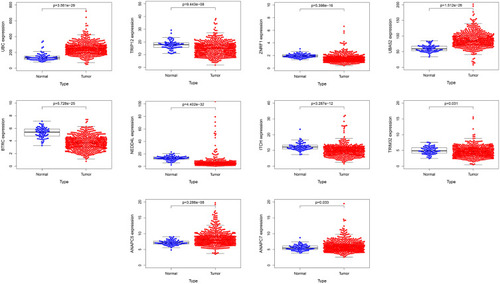
Figure 7 HPA database was used to analyze the difference protein expression of hub genes between ccRCC tissues and normal tissues. (A) UBC protein is highly expressed in ccRCC. (B) TRIP12 protein is highly expressed in ccRCC. (C) ZNRF1 protein is low expressed in ccRCC. (D) UBA52 protein is highly expressed in ccRCC. (E) BTRC protein is low expressed in ccRCC. (F) NEDD4L protein is highly expressed in ccRCC. (G) ITCH protein is low expressed in ccRCC. (H) TRIM32 protein is low expressed in ccRCC. (I) ANAPC5 protein is highly expressed in ccRCC tissues and normal tissues. (J) ANAPC7 protein is highly expressed in ccRCC.
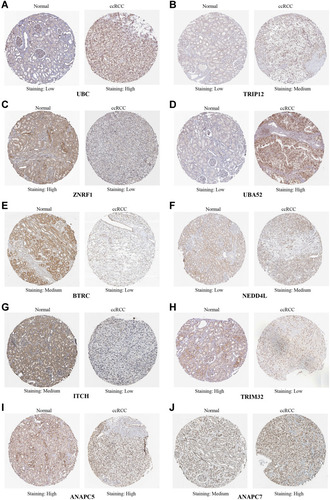
Figure 8 TCGA database was used to analyze the effect of Hub genes expression on the prognosis of ccRCC.
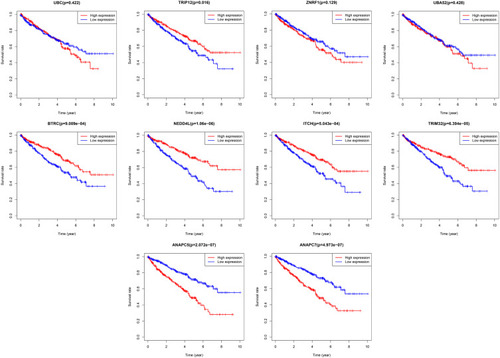
Table 1 Summary of the Functions of 2 Hub Genes
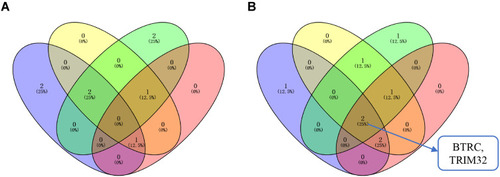
Figure 9 Venn diagram. (A) The intersection of the upregulated hub genes and the hub genes with poor prognosis. Blue circles represent hub genes with upregulated mRNA expression in drug-resistant tissues; yellow circles represent hub genes with upregulated mRNA expression in ccRCC; green circles represent hub genes with upregulated protein expression in ccRCC; red circles represents hub genes related to poor prognosis. (B) The intersection of downregulated hub genes and hub genes with good prognosis. The blue circles represent hub genes with downregulated mRNA expression in drug-resistant tissues; the yellow circles represent hub genes with downregulated mRNA expression in ccRCC; the green circles represent hub genes with downregulated protein expression in ccRCC; and the red circles represent hub genes related to good prognosis.