Figures & data
Table 1 Information on the 21 Effective Compounds of Codonopsis pilosula
Figure 1 Screening of Codonopsis pilosula active compound targets and the interaction network of Codonopsis pilosula targets and hepatocellular carcinoma. (A) Venny analysis of targets for the effective compounds and hepatocellular carcinoma target genes of Codonopsis pilosula. (B) Network diagram of Codonopsis pilosula compound-interactive genes. Yellow represents Hepatocellular carcinoma-related targets, and green represents the active compound of Codonopsis pilosula. (C) Network of Codonopsis pilosula and hepatocellular carcinoma targets. (D) Interaction network of the key hub genes of Codonopsis pilosula targets.
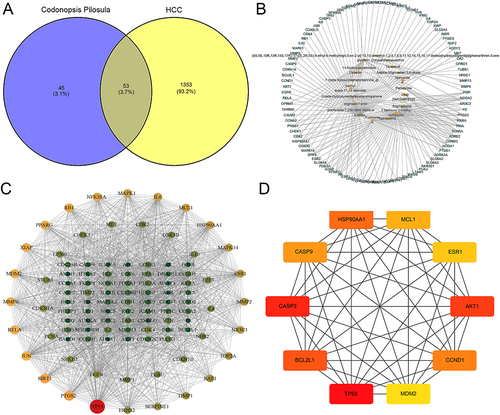
Figure 2 Top 10 GO terms and KEGG signals of overlapping genes between Codonopsis pilosula and hepatocellular carcinoma. (A) GO terms. (B) KEGG pathways.
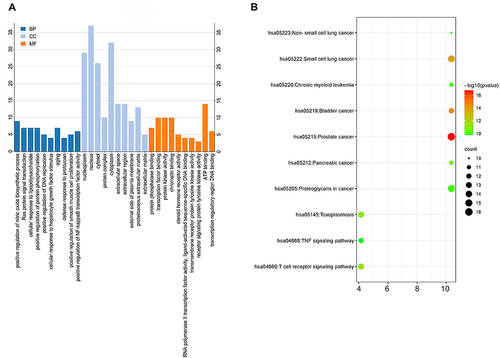
Figure 3 Risk model for patients with hepatocellular carcinoma based on 10 key node genes. (A). LASSO coefficient profiles of 10 protein-coding genes. (B) LASSO regression with tenfold cross-validation obtained six prognostic genes using the minimum lambda value.
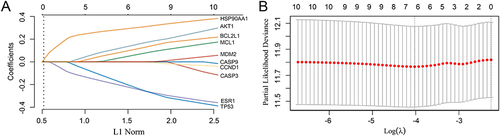
Figure 4 Prognostic analysis of the six-gene signature in the training set. (A) Curve of the risk score. (B) Survival status of the patients, where increased patient death corresponds to a higher risk score. (C) Heatmap of the expression profiles of the six prognostic genes in the low- and high-risk groups. (D) Kaplan–Meier survival analysis of the six-gene signature. (E) Time-dependent receiver operating characteristic analysis of the six-gene signature.
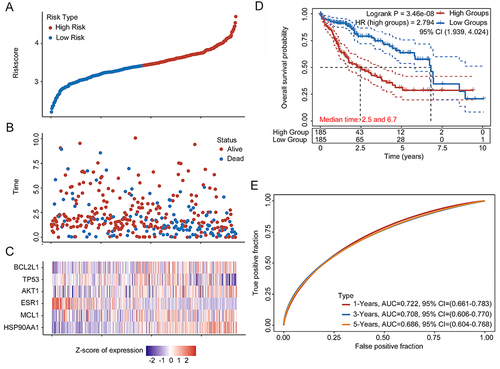
Figure 5 Overall survival (OS) and disease-free survival (DFS) analysis of genes involved in the risk score formula OS and DFS for HSP90AA1, MCL1, ESR1, AKT1, TP53, and BCL2L1 in hepatocellular carcinoma plotted according to the Cancer Genome Atlas dataset.
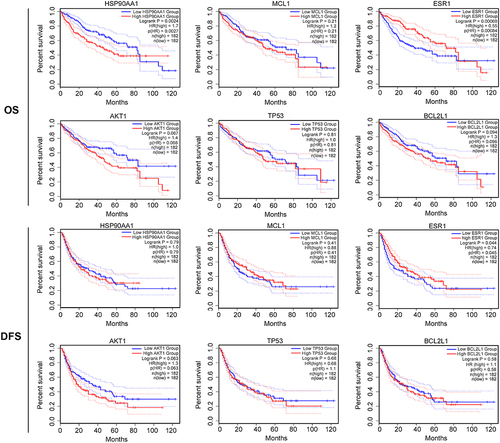
Figure 6 Expression of clinicopathologically relevant genes involved in the risk score formula. (A). Expression of HSP90AA1, MCL1, ESR1, AKT1, TP53, and BCL2L1 in HCC based on the Cancer Genome Atlas database, *P < 0.05. (B) Expression of HSP90AA1, MCL1, ESR1, AKT1, TP53, and BCL2L1 relevant to the clinical stage of hepatocellular carcinoma.
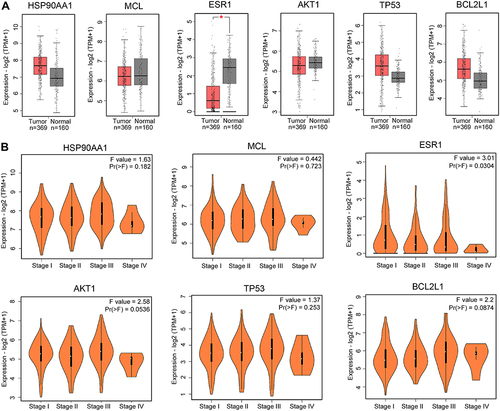
Figure 7 Effects of luteolin-anti hepatocellular carcinoma in vitro. (A) The effect of luteolin on the proliferation of HepG2 cells, as assessed by CCK-8 assay. n = 5, post hoc Dunnett's test, *P < 0.05, **P < 0.01, ***P < 0.001 vs 0 group. (B) Representative images for cell migration. Bars = 200 μm, n = 5, t-test, ***P < 0.001. (C) Representative images for FCM detection of the cell cycle distribution. (D) Quantitative analysis of cell cycle G2/M phase distribution, n = 3, t-test, **P < 0.01. (E) Representative images for luteolin-induced apoptosis, as assessed by flow cytometry. (F) Quantitative results of luteolin-induced apoptosis, n = 3, t-test, ***P < 0.001. (G) Representative bands for Western blotting of p-Akt (Thr 308) and p-JNK. (H). Quantitative results of p-Akt (Thr308) and p-JNK normalized to GAPDH, n = 6, t-test for p-Akt (Thr308), Mann–Whitney test for p-JNK, **P < 0.01.
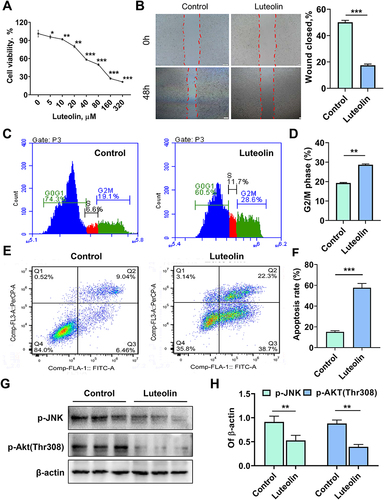
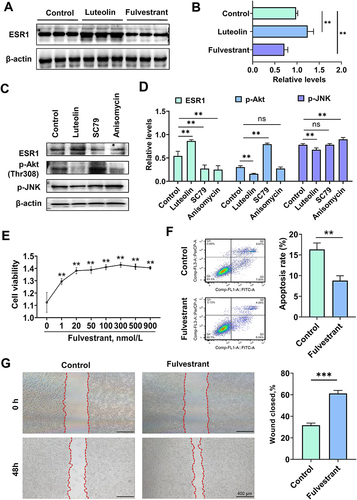
Figure 8 Effects of luteolin on ESR1 expression in hepatocellular carcinoma. (A) Representative bands for Western blot analysis of 50 μmol/L luteolin-, 300 nmol/L fulvestrant-induced ESR1 expression. (B) Quantitative results of luteolin-, fulvestrant-induced ESR1, n = 6, post hoc Dunnett's test, **P < 0.01. (C) Representative bands for Western blot analysis of 50 μmol/L luteolin-, 10 μmol/L SC79- and 4 μmol/L anisomycin-induced ESR1, p-Akt (Thr308) and p-JNK. (D) Quantitative results of luteolin-, SC79-, and anisomycin-induced ESR1, p-Akt (Thr308) and p-JNK expression, n = 5, post hoc Dunnett's test, **P < 0.01. (E) The effect of ESR1 inhibitor fulvestrant on the cell viability of HepG2 cells as assessed by CCK-8 assay, n = 5, post hoc Dunnett's test, **P < 0.01 vs 0 group. (F) ESR1 inhibitor fulvestrant (300 nmol/L) suppressed cell apoptosis, as assessed by flow cytometry, n = 3, t-test, **P < 0.01. (G) ESR1 inhibitor fulvestrant (300 nmol/L) promoted cell migration, n = 5, t-test, ***P < 0.001, Bars = 400 μm.