Figures & data
Figure 1 Scheme (A) and TEM images (B) of AP/Tf-Drn/Lut NPs.
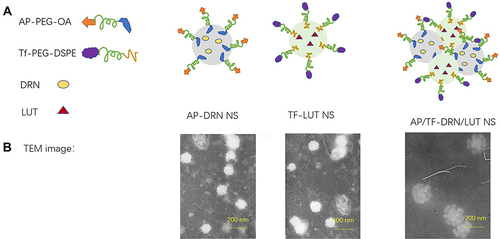
Table 1 Characterization of nanodrug-delivery systems (means ± SD, n=3)
Figure 2 Changes in particle size (A) and EE (B) analyzed in PBS and culture medium (FBS). In vitro drug-release behavior of Drn (C) or Lut (D) from nanosystems evaluated by dialysis.
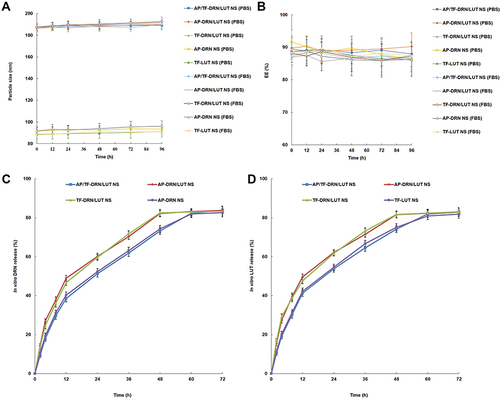
Table 2 Cellular uptake percentages (means ± SD, n=8)
Table 3 CI50 values of AP/Tf-Drn/Lut NPs when different Drn:Lut weight ratios were applied (means ± SD, n=8)
Figure 3 Cytotoxicity of AP/Tf-Drn/Lut NPs and other formulations evaluated with MTS assays.
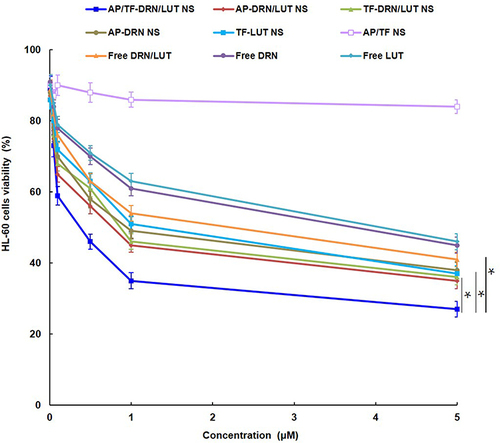
Figure 4 In vivo AML therapy efficiency: Tumor size (A) and body weight (B).
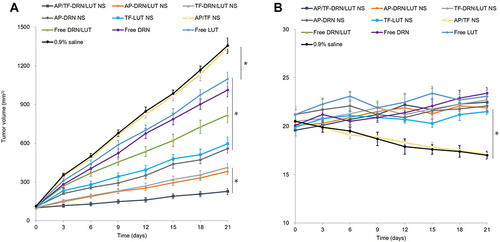
Table 4 Pharmacokinetic parameters for Drn (means ± SD, n=8)
Table 5 Pharmacokinetic parameters for Lut (mean ± SD, n=8)
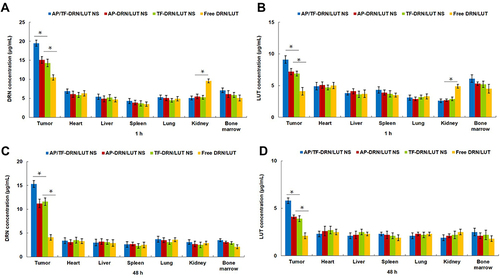
Figure 5 In vivo Drn (A and C) and Lut (B and D) distribution in tissue after 1 h (A and B) and 48 h (C and D) of drug administration. *P<0.05.