Figures & data
Figure 1 Synthesis and characterization of HA-α-TOS (A and B) and Ce6-TPGS1000 (C and D).
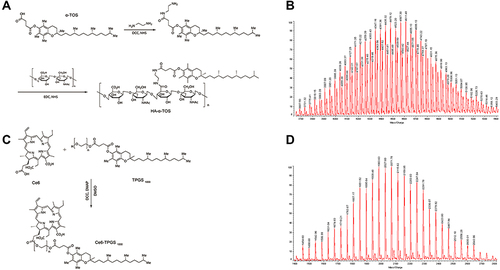
Table 1 Characterization of Prepared Nanoparticles
Figure 2 Characterization of prepared nanoparticles.
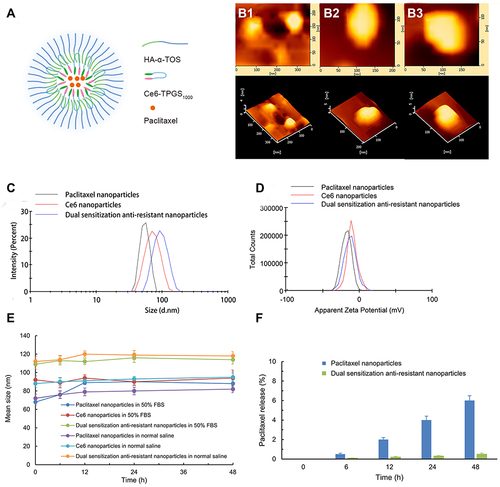
Figure 3 In vitro cytotoxic effect after treating with varying formulations.
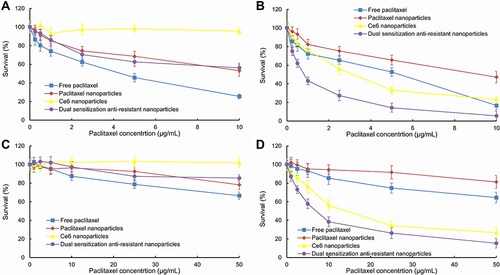
Figure 4 Survival status of drug-resistant MCF-7/adr cells after treatment with varying nanoparticles in dark conditions (A) and after laser irradiation (B).
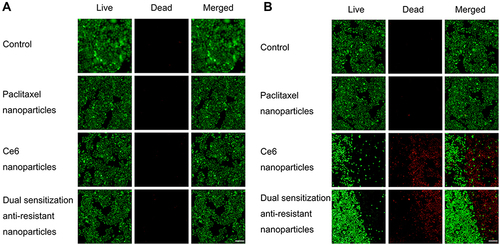
Figure 5 Cellular uptake of various coumarin nanoparticles.
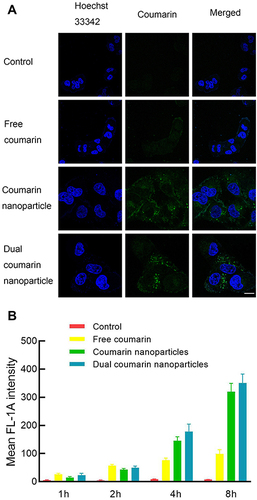
Table 2 Mean Fluorescence Intensity of MCF-7/Adr Cells After Various Nanoparticles’ Exposure
Figure 6 Apoptosis inducing of various nanoparticles.
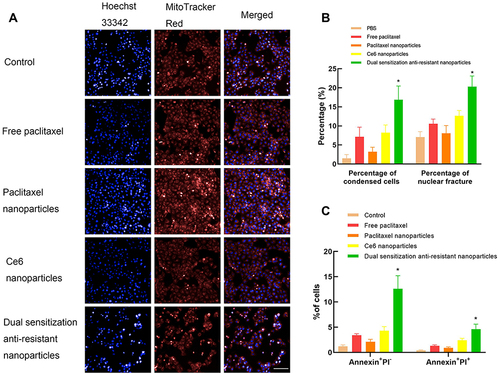
Figure 7 The changed apoptosis-related proteins of drug-resistant MCF-7/adr cells after treatment with various formulations.
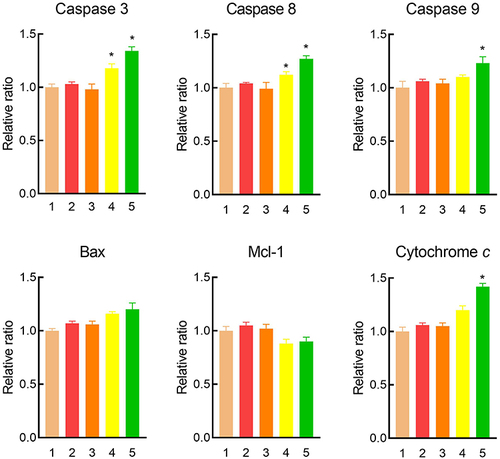
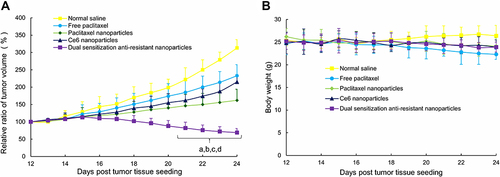
Figure 8 Anticancer efficacy (A) and body weight (B) of the tumor-bearing mice after intravenous administration of varying formulations.