Figures & data
Figure 1 Photographs of different composite nanofibrous mats; (a) PVA 9% (N0), (b) placebo PVA-SA 10% composite nanofibers (N2), (c) verapamil HCl-loaded composite nanofibrous mats. PVA-SA-verapamil HCl 10/4% (N6), (d) placebo PVA-Z (25%) composite nanofibers (Z4), and (e) verapamil HCl loaded composite nanofibrous mats PVA-Z-verapamil HCl (25/2%) (Z5).
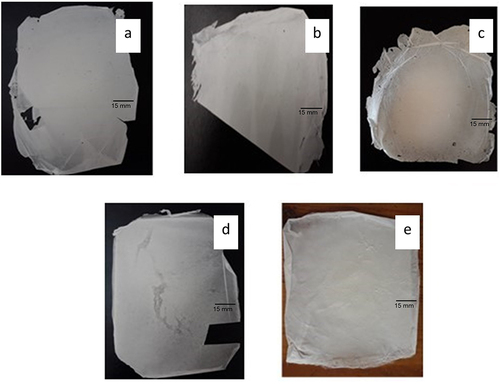
Figure 2 SEM micrographs of (a) pure PVA 9% (N0), (b) placebo PVA-SA 10% (N2), (c) verapamil HCl loaded PVA-SA-verapamil 10.4% (N6), (d) placebo PVA-Z 25% (Z4), and (e) verapamil HCl-loaded PVA-Z-verapamil 25, 2% (Z5).
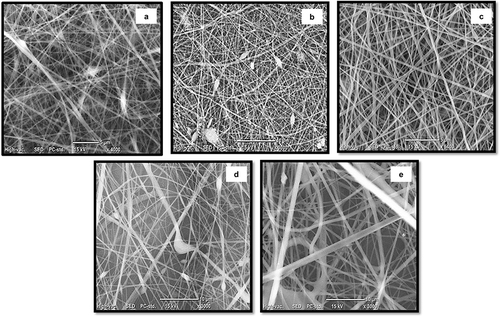
Figure 3 Nanofiber diameter distribution curves of PVA (N0) and composite (PVA-SA; N2 and N6) and (PVA-Z; Z4 and Z5) nanofiber formulations.
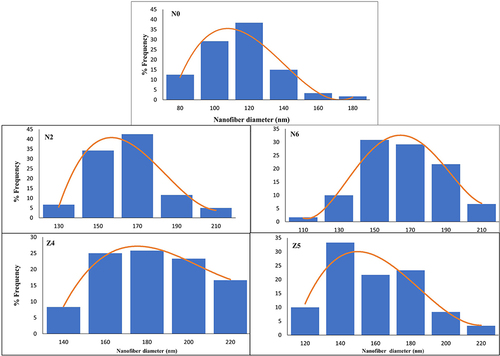
Figure 4 Comparative FTIR Spectra of (a) PVA, (b) SA, (c) verapamil HCl, and (d) PVA-SA-Verapamil HCl loaded nanofibers (N6).
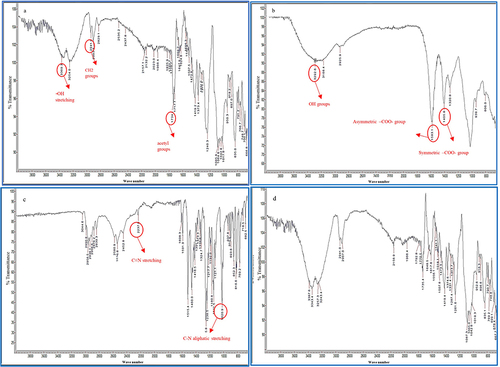
Figure 5 Comparative FTIR spectra of (a) PVA, (b) Z, (c) verapamil HCl, and (d) PVA-Z-verapamil HCl-loaded nanofibers (Z5).
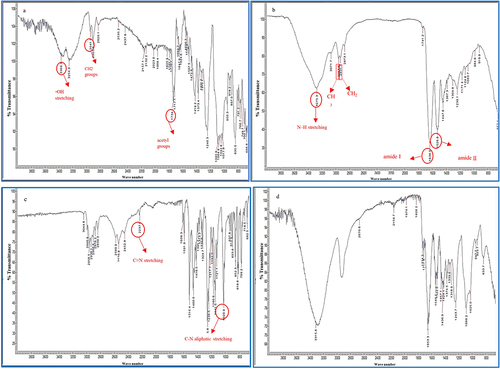
Figure 6 In vitro drug release profiles of verapamil HCl from PVA-SA (N6) and PVA-Z (Z5) composite nanofibers in phosphate buffer pH 7.4 at 32°C.
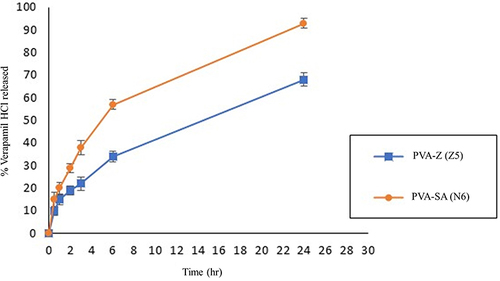
Figure 7 Stages of wound healing of the different treatment groups.
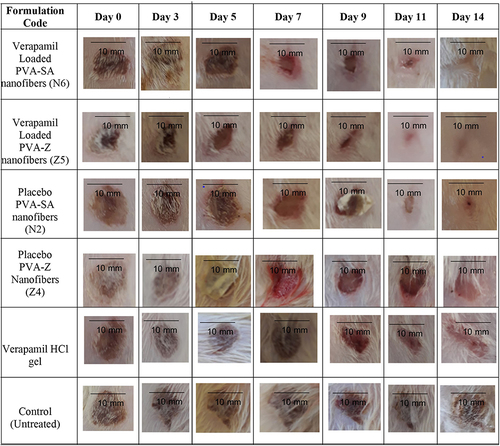
Figure 8 Comparative wound closure percentage of different treatment groups for 14 days.
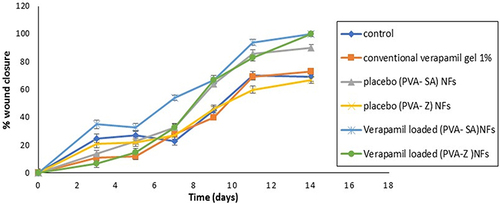
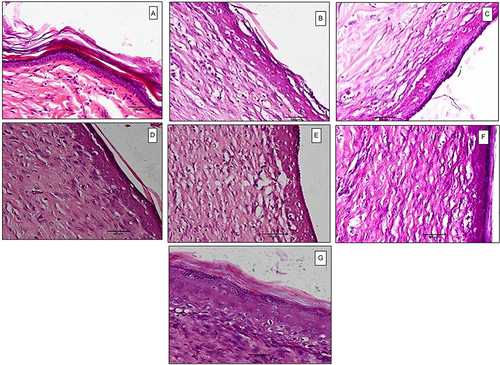
Figure 9 Histopathological examination at 500× magnification power of (a) normal skin, (b) control untreated group, (c) treated with verapamil HCl gel, (d) treated with placebo PVA-SA nanofibers (N2), (e) treated with placebo PVA-Z nanofibers (Z4), (f) treated with verapamil HCl-loaded PVA-SA nanofibers (N6), (g) treated with verapamil HCl-loaded PVA-Z nanofibers (Z5), on day 14 post-wounding.