Figures & data
Figure 1 HE staining in lung tissues (deposition of collagen is pink, magnification, 100 and 200). In the lung tissue of the model group, collagen deposition(pink) was significantly increased, whereas the collagen deposition in the Sch A low-dose group was significantly reduced compared with the model group, and collagen deposition was hardly observed in the high-dose group. The Black arrow: collagen deposition. Scale bar: 50 mm.
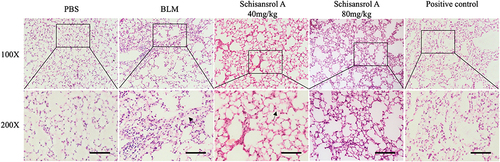
Figure 2 (A and B) OPLS-DA score plot and permutation score plot of serum samples from control and BLM model group; (C and D) OPLS-DA score plot and permutation score plot of serum samples from Sch A treated group and BLM model group.
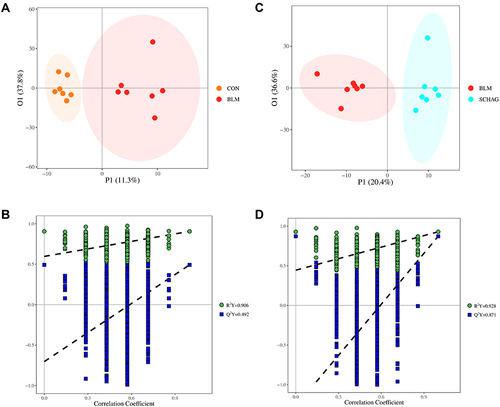
Figure 3 Metabolic data analysis of serums from different groups. (A and B) VIP plot and unidimensional volcano plot from OPLS-DA of serum samples from control and BLM model group (C and D) VIP plot and unidimensional volcano plot from OPLS-DA of serum samples from Sch A treated group and BLM model group.
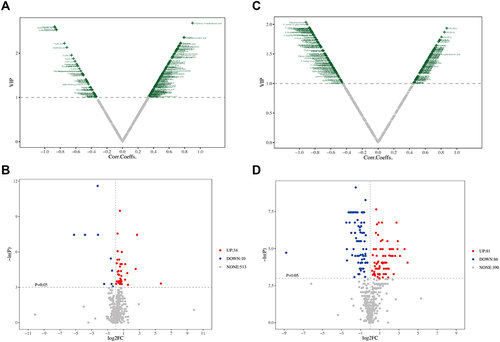
Figure 4 (A) Pathway Analysis of biomarkers reversed by the administration of Sch A in BLM-induced PF model. The most significant metabolic pathways were filtered out and labeled in the figure. Glycine, serine and threonine metabolism, beta-Alanine metabolism, arginine and proline metabolism, phenylalanine metabolism, histidine metabolism these five pathways were included. (B) Schematic diagram of the metabolic pathway, the up-regulation and down-regulation of metabolites were compared with the control group. The metabolites screened as biomarkers were marked with colored boxes and the trend of the biomarkers involved in each metabolic pathway in differently treated groups was represented by the color box.
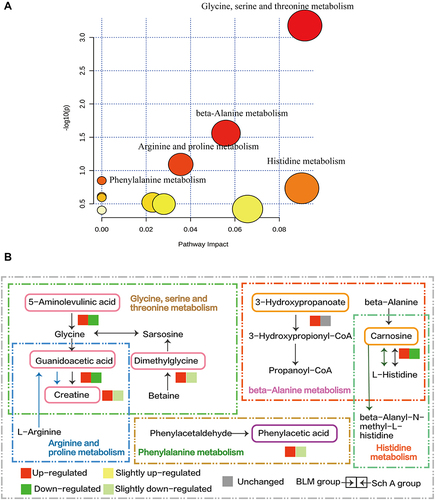
Table 1 Metabolites of Sch A by UPLC-Q-TOF/MS
Figure 5 Proposed major metabolic pathway of schisandrol A.
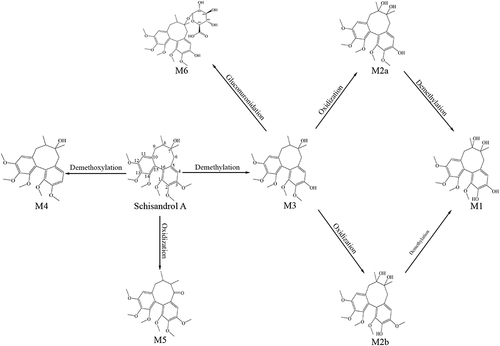
Figure 6 (A) Common targets of drugs (Sch A and corresponding metabolites) and PF. (B) Protein–protein interaction (PPI) analysis of integrated common targets of drugs and PF, the size of the circle represents the degree value of targets. (C) Several adjacent nodes of the top 20 common targets of drugs and PF, The X-axis represents different nodes, the Y-axis represents the number of adjacent nodes of each node, and the exact number of adjacent nodes for each node is marked on the inside of the data column.
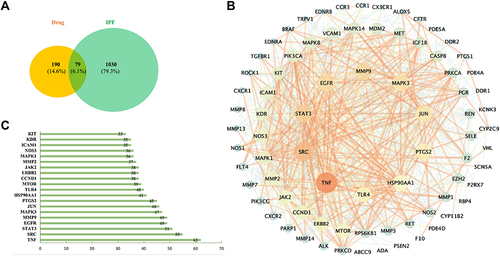
Figure 7 (A) “Compound-gene symbol” network consists of 15 compounds (Sch A with corresponding metabolites which were presented by green nodes) and 79 overlapping targets (yellow) of compounds and disease. (B) “Signal pathway- gene symbol” network of integrated core targets (yellow) and related pathways (blue). (C) Enriched KEGG pathways analysis of integrated core targets. (D) “Signal pathway- gene symbol” network of integrated top 20 core targets and 4 fibrosis-related pathways. (E) Enriched KEGG pathways analysis of top 20 core targets and four fibrosis related pathways.
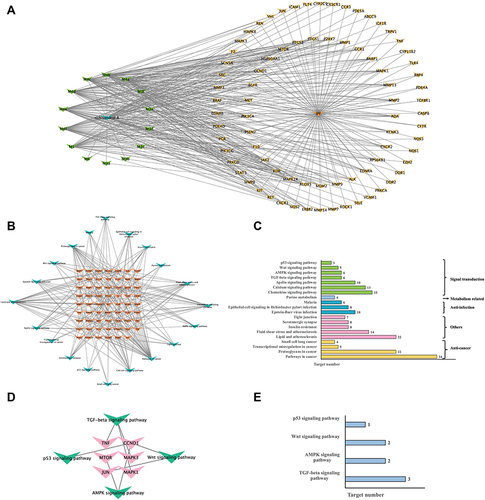
Figure 8 (A) Protein–protein interaction (PPI) of 94 TGF-β signaling pathway-related genes searched from the KEGG database. (B) Column chart of top 25 core genes in A. (C) PPI network analysis of 25 TGF-β signaling pathway-related core genes(purple) in B and metabolomics-related genes (minimum required interaction score=0.4). The nodes on the right are metabolomics-related genes, the bigger the size of the node, the higher the degree it has. (D) Simplified interaction network of local interactions between metabolomics-related genes and TGF-β signaling pathway-related targets. The pink nodes are the gene symbols related to the TGF-β signaling pathway, others are metabolites related, the thickness of the line represents the level of combined scores.
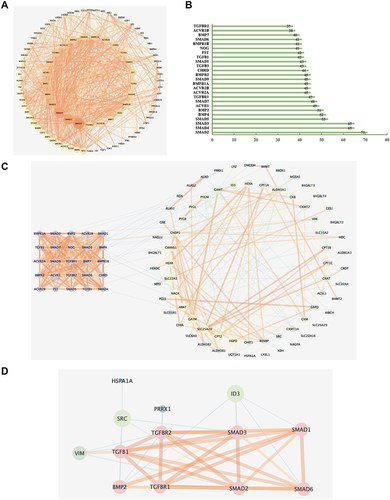
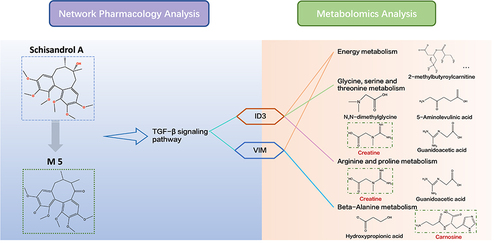
Figure 9 Integrated analysis of network analysis and metabolomics. The biomarkers involved in the corresponding metabolic pathways were obtained by KEGG analysis. Gene-related metabolites involved in the metabolism pathway were shown on the red label.