Figures & data
Table 1 Demographics and Baseline Subject Characteristics (Safety Analysis Set)
Figure 1 Study flow design.
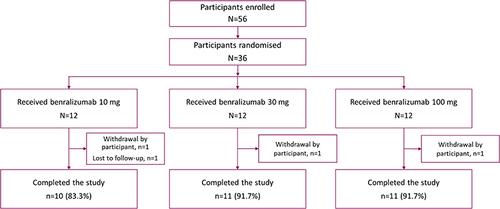
Table 2 Summary of Adverse Events Reported During the On-Study Period (Safety Analysis Set)
Figure 2 Blood eosinophil count over the study †period (safety analysis set). †Day 0 was pre-dose. Baseline (Day 0) was defined as the last non-missing measurement prior to the injection of study treatment. Error bars show minimum and maximum eosinophil counts.
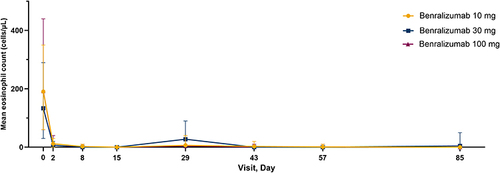
Figure 3 Geometric mean serum concentration-time profile of benralizumab following single SC dose administration on Day 1 (semi-log scale) (PK analysis set). Nominal sampling elapsed time (ie time difference between nominal sampling time and dosing time) is used for mean summary plots. Pre-dose time equals to zero. Samples collected outside the protocol-defined window were excluded from summary statistics. Vertical line represents the Geometric mean ± SD=exp{mean (individual log-transformed values) ± SD (individual log-transformed values)}.
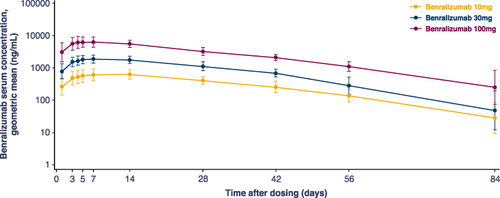
Table 3 Pharmacokinetic Parameters of Benralizumab Following Single SC Dose Administration on Day 1 (PK Analysis Set)
Table 4 Anti-Drug Antibody Response (Safety Analysis Set)
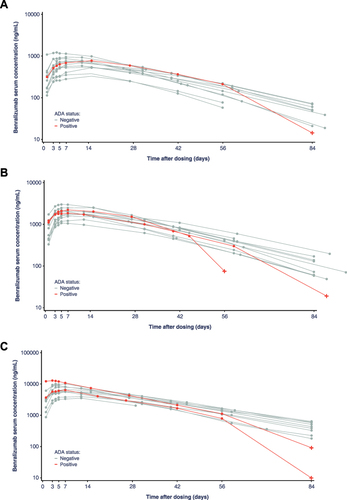
Figure 4 Individual serum concentration of benralizumab following single SC dose administration by ADA status; (A) benralizumab 10mg, (B) benralizumab 30mg, (C) benralizumab 100mg (semi-log scale). Red crosses indicate the time point when the sample was ADA positive; for one participant in the 30 mg group who tested ADA positive in the Day 57 and Day 84 samples, the benralizumab serum concentration was <LLOQ at Day 84 and is not shown in the plot. Actual sampling elapsed time (ie time difference between actual sampling time and dosing time) is used for individual plots. After the first quantifiable concentration, any <LLOQ serum concentrations is regarded as missing.