Figures & data
Table 1 Primers for Real-Time PCR
Figure 1 Body weight and blood glucose in each group. (A) Db/db mice put on body weight. (B) Db/db mice have elevated blood glucose. Values measured are presented as the mean ± SD (n = 10). *P < 0.05 vs control group.
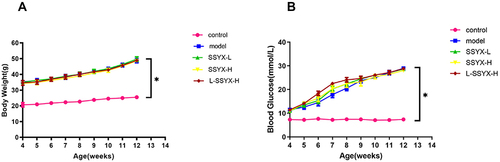
Figure 2 Typical electrocardiogram expressions before and after intraperitoneal isoprenaline and arrhythmia susceptibility in each group. (A) Typical electrocardiogram expressions before and after intraperitoneal isoprenaline in each group. (B) Arrhythmia induction rate in each group (n = 6).
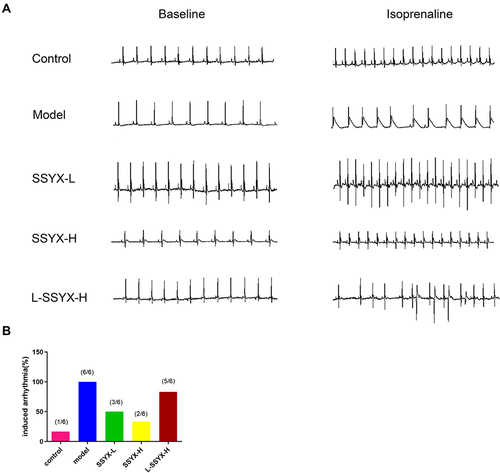
Figure 3 ECG parameters at baseline in each group. (A) The heart rate, (B) PR interval, (C) RR interval, (D) P duration, (E) QT interval, and (F) QTc interval in each group. Values measured are presented as the mean ± SD (n = 6). **P < 0.01 vs control group. *P < 0.05 vs control group. ##P < 0.01 vs model group. #P < 0.05 vs model group. $$P < 0.01 vs SSYX-H group. $P < 0.05 vs SSYX-H group.
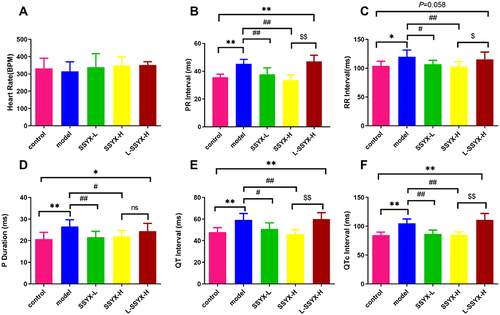
Figure 4 ECG parameters after intraperitoneal injection of isoproterenol in each group. (A) The heart rate, (B) PR interval, (C) RR interval, (D) P duration, (E) QT interval, and (F) QTc interval in each group. Values measured are presented as the mean ± SD (n = 6). **P < 0.01 vs control group. *P < 0.05 vs control group. ##P < 0.01 vs model group. #P < 0.05 vs model group. $$P < 0.01 vs SSYX-H group. $P < 0.05 vs SSYX-H group.
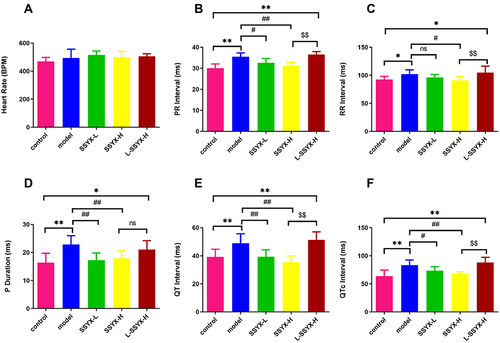
Figure 5 Conduction direction and time of isolated heart measured by electrical mapping. (A) Conduction direction of atrium and ventricle in each group. (B) Atrial conduction time and (C) ventricular conduction time in each group. Values measured are presented as the mean ± SD (n = 3). **P < 0.01 vs control group. ##P < 0.01 vs model group. $$P < 0.01 vs SSYX-H group. $P < 0.05 vs SSYX-H group.
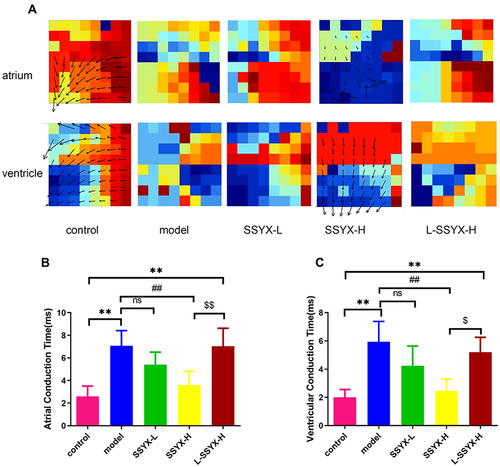
Figure 6 Effects of SSYX on the mRNA expression of Kv 4.2, Kv 4.3, Cav 1.2, and Nav 1.5. (A) Kv 4.2, (B) Kv 4.3, (C) Cav 1.2, and (D) Nav 1.5 mRNA expression levels were normalized to the arithmetic mean of GAPDH and analyzed using the threshold cycle (CT) relative quantification method. The mRNA expression levels were quantified using the 2−ΔΔCT method for comparison. Values measured are presented as the mean ± SD (n = 3). **P < 0.01 vs control group. *P < 0.05 vs control group. ##P < 0.01 vs model group. #P < 0.05 vs model group. $$P < 0.01 vs SSYX-H group. $P < 0.05 vs SSYX-H group.
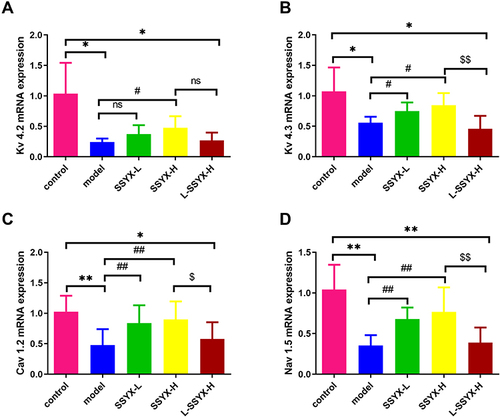
Figure 7 Effects of SSYX on the gap junction of myocardial cells and the protein expression of Cx43. (A) Representative images of immunofluorescence double staining for each group, α-actinin, Cx43, and DAPI were marked in red, green, and blue respectively (200 ×). (B) The protein expression of Cx43. Values measured are presented as the mean ± SD (n = 3). **P < 0.01 vs control group. *P < 0.05 vs control group. ##P < 0.01 vs model group. $$P < 0.01 vs SSYX-H group.
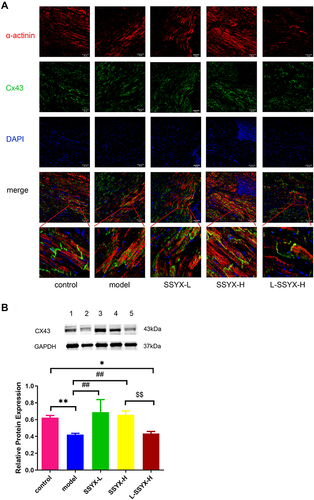
Figure 8 Effects of SSYX on histopathological changes of the heart observed by HE and Masson staining (200 ×). (A) Representative images of HE staining for each group. (B) Representative images of Masson staining for each group. (C) The myocardial collagen volume fraction of Masson staining. Values measured are presented as the mean ± SD (n = 3). **P < 0.01 vs control group. ##P < 0.01 vs model group. #P < 0.05 vs model group. $$P < 0.01 vs SSYX-H group.
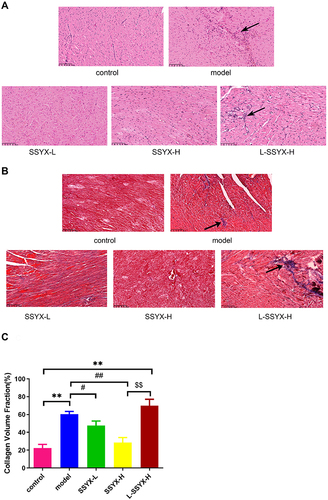
Figure 9 Continued.
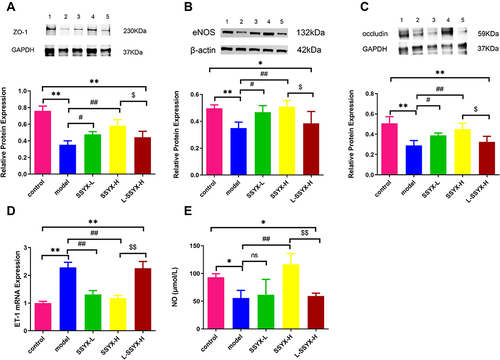
Figure 9 Effects of SSYX on the protein expression of ZO-1, eNOS, occludin, the mRNA expression of ET-1, NO content, and the expression of CD31 and eNOS observed by immunofluorescence double staining in the heart tissue. The protein expression of (A) ZO-1, (B) eNOS, and (C) occludin in each group. (D) The ET-1 mRNA expression in each group. (E) The NO content in each group. (F) Representative images of immunofluorescence double staining for each group. ENOS, CD31, and DAPI were marked in red, green, and blue respectively. The overlap parts of CD31 and eNOS were marked in yellow (200×). Values measured are presented as the mean ± SD (n = 3). **P < 0.01 vs control group. *P < 0.05 vs control group. ##P < 0.01 vs model group. #P < 0.05 vs model group. $$P < 0.01 vs SSYX-H group. $P < 0.05 vs SSYX-H group.
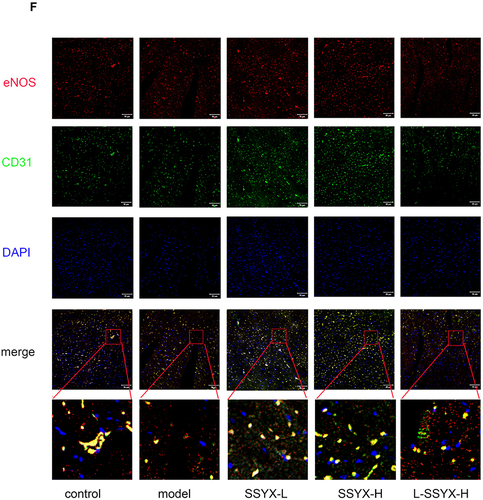
Figure 10 Continued.
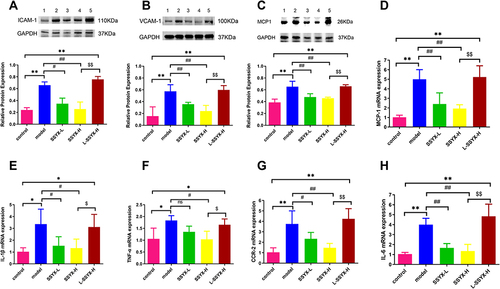
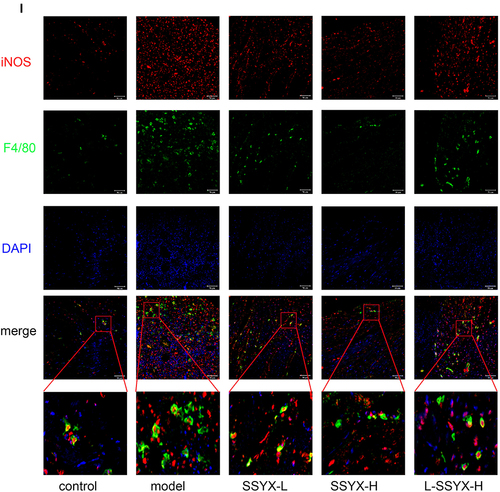
Figure 10 Effects of SSYX on the protein expression of ICAM-1, VCAM-1, MCP-1, the mRNA expression of MCP-1, IL-1β, TNF-α, CCR-2, IL-6, and the expression of iNOS and F4/80 observed by immunofluorescence double staining in the heart tissue. The protein expression of (A) ICAM-1, (B) VCAM-1, and (C) MCP-1 in each group. The mRNA expression of (D) MCP-1, (E) IL-1β, (F) TNF-α, (G) CCR-2, (H) IL-6 in each group. (I) Representative images of immunofluorescence double staining for each group. INOS, F4/80, and DAPI were marked in red, green, and blue respectively (200 ×). Values measured are presented as the mean ± SD (n = 3). **P < 0.01 vs control group. *P < 0.05 vs control group. ##P < 0.01 vs model group. #P < 0.05 vs model group. $$P < 0.01 vs SSYX-H group. $P < 0.05 vs SSYX-H group.