Figures & data
Figure 1 Compounds of CSSGF scanned by LC-MS/MS. (a) MRM of CSSGF (positive mode). (b) MRM chromatogram of CSSGF (negative mode).
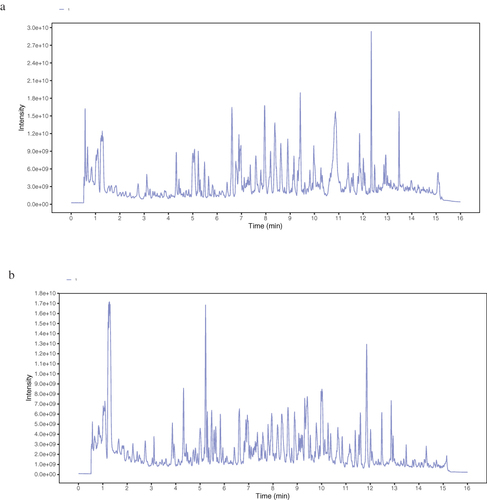
Figure 2 Prediction of TNBC related targets. (a) Identification of deferentially expressed genes (DEGs) between breast cancer and breast normal tissues.(b)The volcano data of different gene between breast cancer and breast normal tissues. The blue part shows the downregulated genes. The red part indicates the upregulated genes. And the black part represents the stable genes. (c) Identification of deferentially expressed genes in GEO data set with GSM38959.(d) The volcano data of different gene in the GSM38959 dataset. (e)The intersecting genes in the GEO and TCGA databases. (f)The volcano data of different gene of intersecting genes in the GEO and TCGA databases.
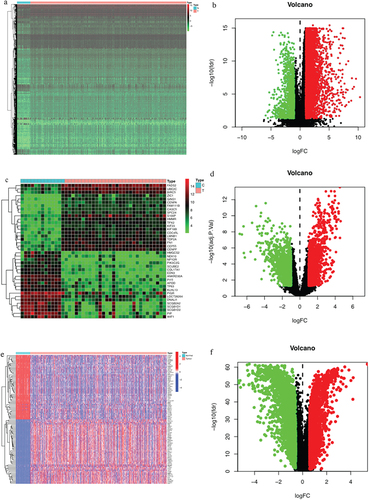
Table 1 Information on Active Compounds of CSSGF Screened by TCMSP
Figure 3 CSSGF-ingredient-target-network. (a)Venn diagram of the target of CSSGF and the target of TNBC. (b) CSSGF ingredient-TNBC target. (c)The PPI network of CSSGF and TNBC targets. (d)The top 30 gene of CSSGF ingredient-TNBC.(e) Top 10 hub genes.
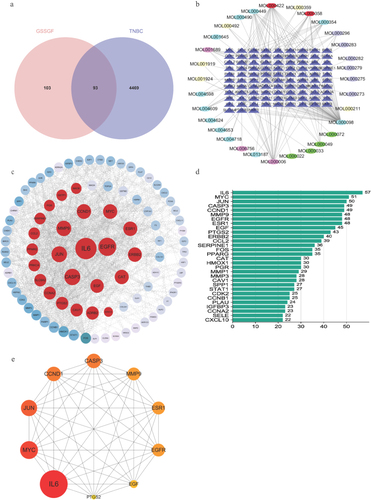
Table 2 Top ten Targets Information of PPI Network
Figure 4 GO and KEGG enrichment analysis of CSSGF -TNBC targets. (a) GO-BP enrichment analysis for potential targets of CSSGF-TNBC. (b). GO-CC enrichment analysis for potential targets of CSSGF-TNBC.(c). GO-MF enrichment analysis for potential targets of CSSGF-TNBC.(d) KEGG pathway enrichment analysis for potential targets of CSSGF-TNBC. (q value refers to -log10 P value). (e) “CSSGF -TNBC target–key pathways” network.
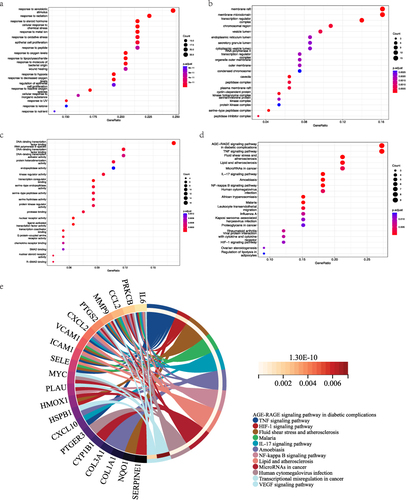
Figure 5 The survival analysis via the Kaplan–Meier plotter. (a) The survival plot of JUN gene.(b) The survival plot of EGFR gene. (c) The survival plot of IL-6 gene.(d) The survival plot of ESR1 gene. (e) The survival plot of PTGS2 gene.(f) The survival plot of c-Myc gene.(g)The survival plot of MMP1 gene.(h)The survival plot of Apopain (Caspase-3) gene.
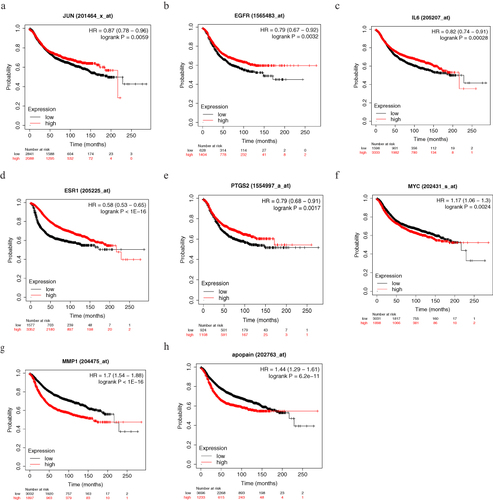
Figure 6 CSSGF could down-regulate the expression of c-Myc and up-regulate the expression of EGFR both in MDA-MB-231 and MCF-7 cells. (a) WB results after drug treatetment in MDA-MB-231 cells.(b) Statistic results of a.**p<0.01,*: p<0.05, ns: no significant difference. (c) WB results after drug treatetment in MCF-7 cells.(d) Statistic results of c.**: p<0.01.*: p<0.05.
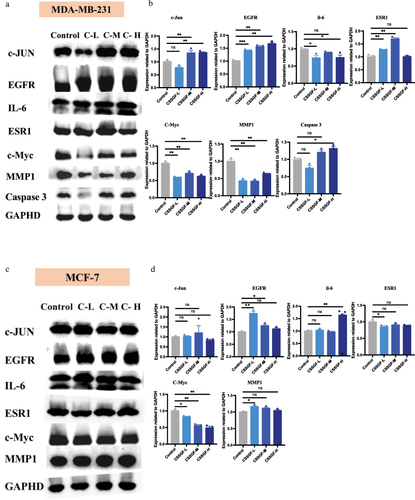
Figure 7 Molecular docking results of core chemical components of CSSGF. (a) Quercetin- EGFR; (b) Quercetin- EGF; (c) Quercetin- c-Myc; (d) Beta-sitosterol-JUN; (e) Luteolin- CASP3; (f) Catechin- ESR1.
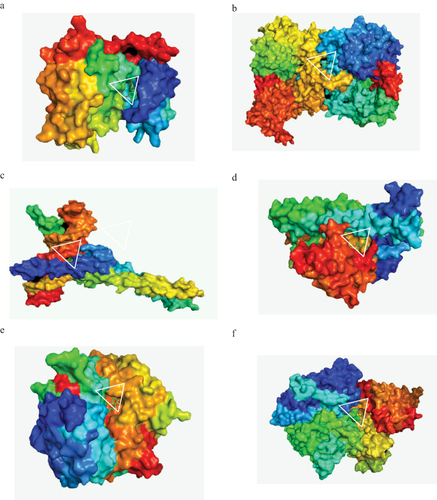
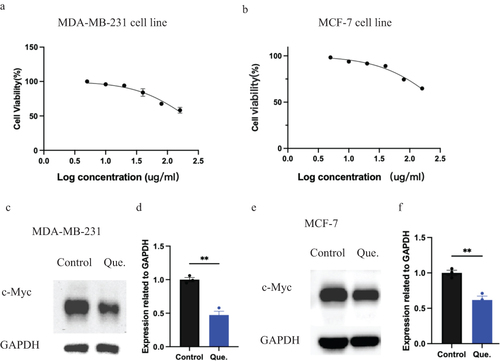
Figure 8 Quercetin could downregulate the expression of C-Myc both in MCF-7 cells and MDA-MB-231 cells. (a) CCK-8 assay in quercetin treated MDA-MB-231 cells.(b) CCK-8 assay in quercetin treated MCF-7 cells. (c)WB results of quercetin treated MDA-MB-231 cells.(d) Statistic results of c.**p<0.01.(e) WB results of quercetin treated MCF-7 cells.(f) Statistic results of e.**p<0.01.