Figures & data
Table 1 Primer Sequences for Quantitative Real-Time PCR
Table 2 The Detailed Information of Active Ingredients Contained in E.G
Figure 1 The total ion chromatogram of E.G in positive ion modes.
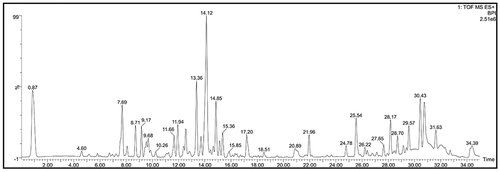
Figure 2 E.G decelerated the KOA progression in DMM-induced osteoarthritic mice. (A) ABH staining and TB staining of the right knee joint in C57BL/6 mice (surgical one). Morphological quantitative analysis of (B) area of tibial cartilage (mm2) and (C) thickness of tibial cartilage (μm). (D) OARSI scoring of the sections analyzed by histomorphometry. (E) Representative 3D reconstruction of the right knee joint and subchondral bone. Scale bar=100 μm. (F) BV/TV (%) and (G) Tb.Th (mm) were quantitative analysis data of the subchondral bone. All data were taken as means ± standard deviations (n=6). The corresponding graph provided the exact P value.
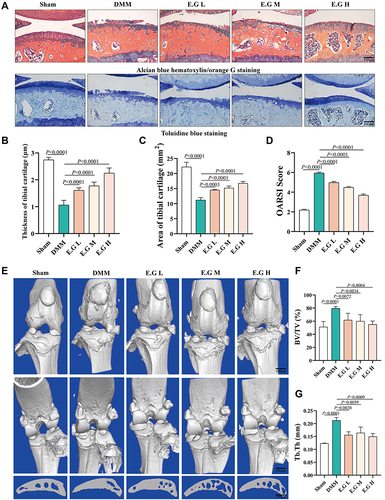
Figure 3 E.G alleviated behavioural pathological changes and pain in the DMM-induced KOA mice. (A) Swing (S), (B) Stride length (cm), (C) Paw area (cm2) of the right hind limb and (D) hot plate reaction time (S) of mice were detected. All data were taken as means ± standard deviations (n=6). The corresponding graph provided the exact P value.
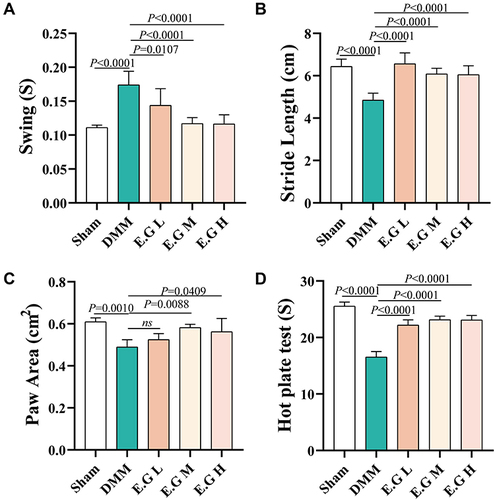
Figure 4 E.G inhibited degradation of extracellular matrix in osteoarthritic articular cartilage. (A) Immunohistochemical staining of MMP13, Col2 and Aggrecan in cartilage. Scale bar=100 μm. (B–D) Quantification of the positive repression area of Col2 (mm2), Percentage of positive expression of MMP13 (%) and Aggrecan (%). (E–H) Relative mRNA expression of Col2, Mmp13, Aggrecan and Adamts5 of IL-1β-induced primary mice chondrocytes treated with EGS. All data were taken as means ± standard deviations (n=6). The corresponding graph provided the exact P value.
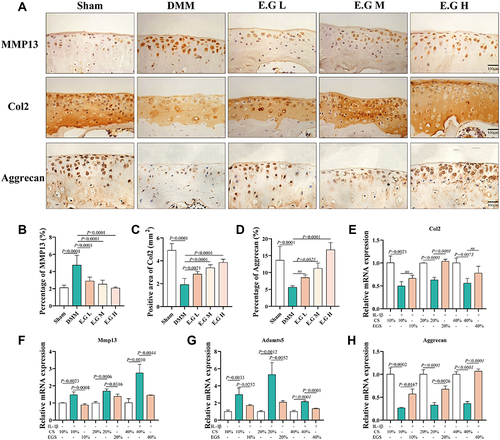
Figure 5 Network pharmacology and molecular docking analysis. (A) KOA’s disease target overlaps between the GeneCards, OMIM, PharmGkb, TTD and Drugbank database. (B) Overlaps between KOA’s targets and E.G drug targets. (C) PPI network and (D) core target screening. (E) E.G-target-KOA network. The circular node represents the traditional Chinese medicine component, the rectangular node represents the disease target, and the arrow node represents the common component of the two drugs. (F) GO enrichment analysis and (G) KEGG pathways enrichment analysis. (H) Molecular docking revealed the binding of beta-Glycyrrhetinic acid, syringetin, (+)-Pinoresinol-di-O-β-D-glucoside and semilicoisoflavone to PPARG protein.
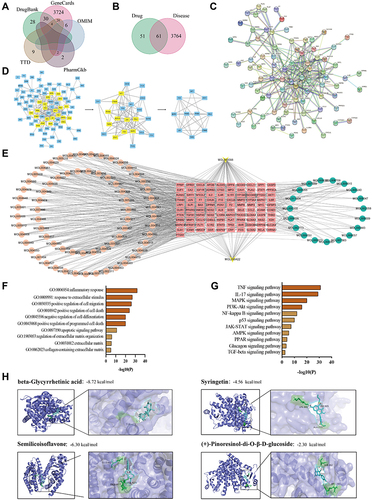
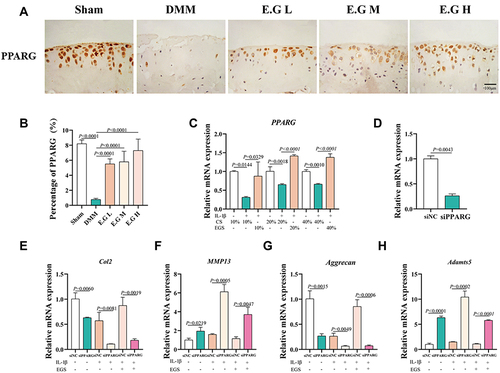
Figure 6 E.G regulated the synthesis and catabolism of chondrocytes in a PPARG-dependent manner. (A) Immunohistochemical staining of PPARG in cartilage. Scale bar=100 μm. (B) Quantification of the percentage of positive expression of PPARG (%). (C) Relative mRNA expression of PPARG in IL-1β-induced primary chondrocytes treated with EGS. (D) The transfection efficiency of siPPARG. (E–H) The mRNA expression of Col2, Aggrecan, MMP13, Adamts5. The primary mice chondrocytes were transfected for 48h and then treated with drug-containing serum for 24h. All data were taken as means ± standard deviations (n=6). The corresponding graph provided the exact P value.