Figures & data
Figure 1 RUT, 5-FU inhibited proliferation of HCT116, HT29 and SW480 cells. (A and B) Chemical structure of 5-FU and RUT. (C–H) The cell viability rate analysis of RUT (2.5, 5, 10, 20, 40, 80, 160 μM) or 5-FU (6.25, 12.5, 25, 50, 100, 200, 400 μM) treatment. The 24 h IC50 in 3 cell lines were shown respectively.
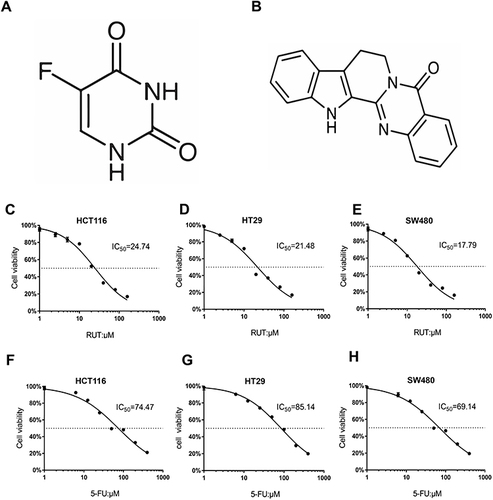
Table 1 The Combination Index (CI) Values of Combinations of RUT with 5-FU in Three Cell Lines
Figure 2 (A–F) MTT assay was used to evaluate cell viability rate of colorectal tumor cells (HCT116, HT29 and SW480) treated with DMSO, RUT (2.5, 5μM) and or 5-FU (10, 25, 50, 75, 100μM) for 24 h alone or in combination. n=3,*P < 0.05, **P < 0.01, ***P < 0.001 compared with DMSO group.
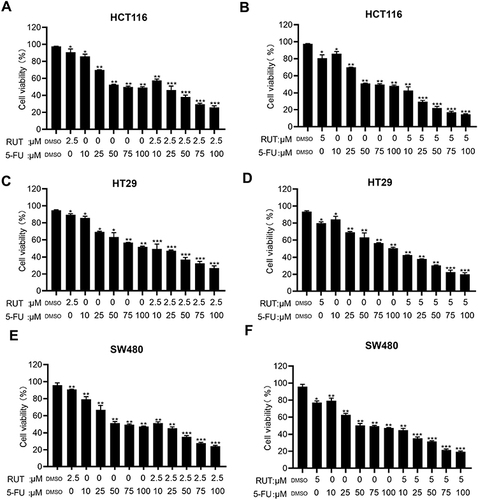
Figure 3 (A–F) The synergistic effects of the combination of RUT (2.5, 5μM) and 5-FU (10, 25, 50, 75, 100μM) for 24 h were analyzed by dose effect diagram and medium effect diagram, respectively. (G–I) The effect of DMSO (control), RUT (5μM), 5-FU (10μM), RUT (5μM) and 5-FU (10μM) on colony formation. (J–L) Bar graphs represent means ± standard deviation (SD) of colonies in HCT116, HT29, and SW480 cells treated with 5μM RUT with or without 10μM 5-FU for 12 days. n=3,*P < 0.05, **P < 0.01, ***P < 0.001 compared with DMSO group.
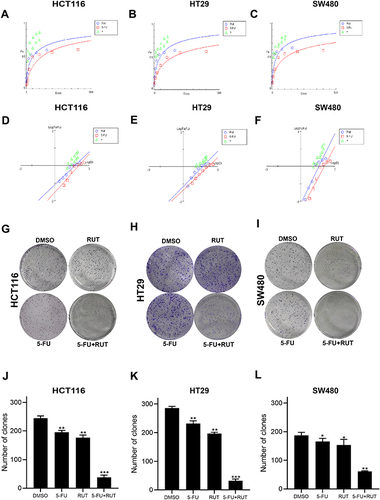
Figure 4 Wound and Transwell assays results showing the effects of different drug treatments on migration of HCT116, HT29 and SW480 cell. (A–F) The results of wound healing test showed that the migration ability of cells treated with DMSO (control), RUT (5μM), 5-FU (10μM), RUT (5μM) and 5-FU (10μM). (G–L) The results of transwell assay showed that the migration ability of cells treated with DMSO (control), RUT (5μM), 5-FU (10μM), RUT (5μM) and 5-FU (10μM). (Scale bar: 100μm). n=3,*P < 0.05, **P < 0.01, compared with DMSO group.
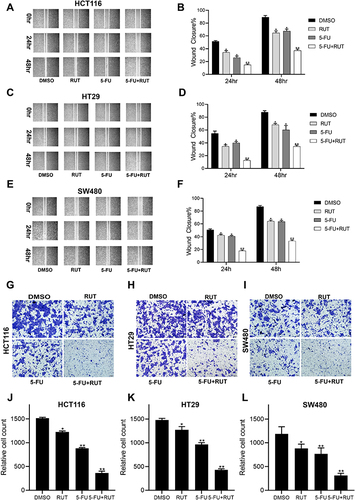
Figure 5 (A–F) Apoptosis-inducing effect of RUT, 5-FU and their combination on HCT116, HT29 and SW480 cells. The percentage of apoptotic cells was determined by flow cytometry after being treated with DMSO, RUT, 5-FU and their combination respectively for 24 h. (G–N) The expression of related proteins (p-STAT3, STAT3, c-Myc, GAPDH, CDK4, Bcl-2, c-Caspase 3) in cells treated with DMSO, RUT, 5-FU and 5-FU+RUT were detected 24 h later. n=3,*P < 0.05, **P < 0.01, ***P < 0.001 compared with DMSO group.
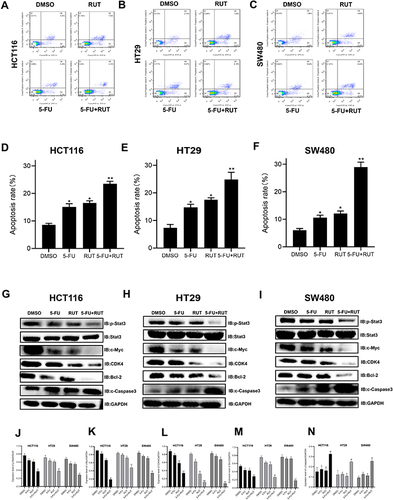
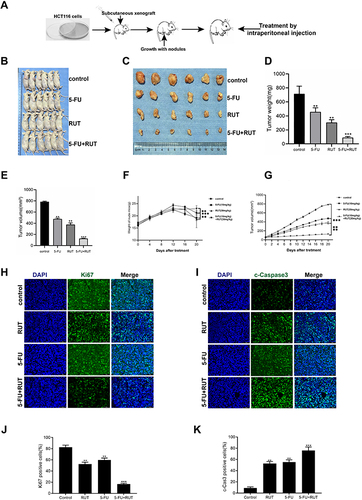
Figure 6 In vivo antitumor effects of RUT and or 5-FU on transplanted HCT116 cells in nude mice. (A) procedure for establishment of a xenograft model and injection of normal saline (control), RUT (30mg/kg), 5-FU (10mg/kg) and RUT (30mg/kg) + 5-FU (10mg/kg) for 20 days. (B and C) tumor images. (D) Tumor weight at the end of the experiment. (E) Tumor volume at the end of the experiment. (F) Weight changes in nude mice in different treatment groups. (G) volume changes in nude mice were recorded every two days during the whole treatment period. (H–K) H&E staining and statistical results of tumor tissue in groups. (Scale bar: 50μm). n=6, *P < 0.05, **P < 0.01, ***P < 0.001, compared with the control group.