Figures & data
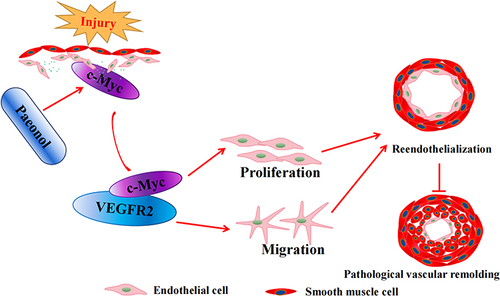
Figure 1 Paeonol attenuates vascular stenosis induced by vascular injury. (A) Schematic diagram of murine carotid artery catheter guide wires and Paeonol treatment. (B) Representative images of left carotid artery catheter guide wires injury after 7 days of Paeonol treatment of H&E staining (Scale bar: 50 μm). (C and D) Quantification of neointima area of left carotid artery cross-section and the ratio of neointima area to media area were analyzed by Image J (n=9). (E) Representative images of the left carotid artery after Paeonol treatment for 10 days of H&E staining (Scale bar: 50 μm). (F and G) Quantification of neointima area of left carotid artery cross-section and the ratio of neointima area to media area (n=9). (H) IF staining against CD31 and SM α-actin antibodies on the injured artery slides after Paeonol treatment for 7days (Scale bar: 100 μm). Quantitative data presented as mean ± SEM, *P < 0.05 was considered significant.
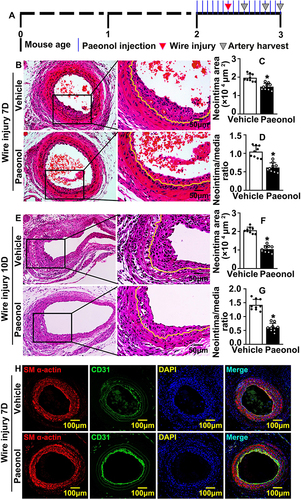
Figure 2 Paeonol promotes vascular endothelial cell proliferation. (A) CCK-8 Assay detecting HUVEC viability and proliferation after Paeonol (10 μM) treatment for 24 hours (n=8). (B) Cell numbers at different time points (24 hours, 48 hours, 72 hours) after HUVEC-Cs treated with Paeonol (n=6). (C) Real Time PCR detected mRNA expression levels of cell cycle-related genes (n=6). (D) HUVEC-Cs were treated with Paeonol for 48 hours. Cell cycle analyzed using flow cytometry analysis after Propidium Iodide (PI) staining (n=5). (E) BRDU incorporation assay performed to evaluate incorporation of BRDU into HUVECs (Scale bar: 20 μm). (F). Quantification of BRDU positive cells (n=6). (G) IF staining against CD31 and PCNA antibodies on slides after Paeonol treatment for 7 days (Scale bar: 100 μm. White triangles represented the positive signal of specific antibodies). Quantitative data presented as mean ± SEM, *P < 0.05 was considered significant.
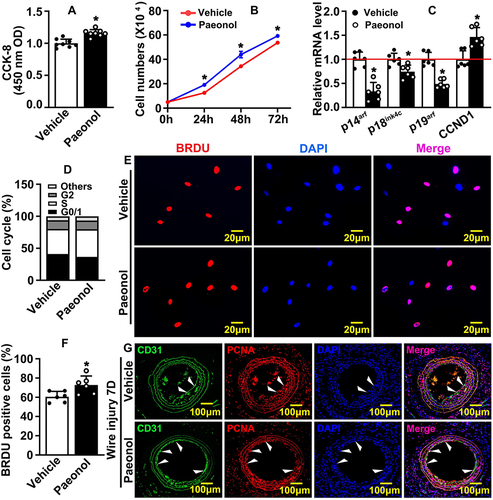
Figure 3 Paeonol promotes vascular endothelial cell motility. (A) Boyden migration assay evaluating cell motility after HUVECs were treated with Paeonol. Images were captured after crystal violet staining (Scale bar: 50 μm). (B) Quantification of migrated cells (n=6). (C) Matrigel based tube formation assay was performed after HUVEC-C treated with Paeonol (Scale bar: 50 μm). (D) Quantification of tube numbers (n=6). (E) The migrating ability of HUVECs after Paeonol treatment was evaluated by spheroid assay after Calcein AM staining (Scale bar: 20 μm). Sprouting numbers and sprouting lengths were quantified using the Image J software and exhibited in (F and G) (n=6). (H) The mRNA levels of migration-related genes (n=6). (I) The expression of VE-Cadherin in HUVEC was determined by IF staining (Scale bar: 20 μm). (J) Fluorescence intensity (FI) of VE-Cadherin quantified (n=6). Quantitative data presented as mean ± SEM, *P < 0.05 was considered significant.
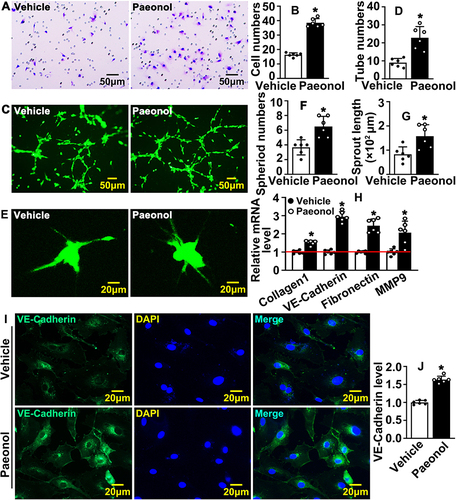
Figure 4 Paeonol induces endothelial cell c-Myc expression after vascular injury. (A) Western blot analysis of c-Myc protein expression in HUVEC-Cs after treated with different dose of Paeonol (1 μM, 5 μM, 10 μM, 15 μM, 20 μM). (B) Quantification of relative c-Myc protein after different dose of Paeonol treatment (n=6). (C) Western blot analysis of c-Myc protein expression in HUVEC-Cs after treated with Paeonol (10 μM) for different time points (6 hours, 12 hours, 24 hours, 36 hours, 48 hours). (D) Quantification relative c-Myc protein after different time points of treatment (n=6). (E) IF staining against c-Myc antibody performed in HUVEC-Cs after Paeonol treatment (Scale bar: 20 μm). (F) Fluorescence intensity of c-Myc was analyzed (n=6). (G) IHC staining against c-Myc antibody performed on slides after Paeonol treatment for 7 days (Scale bar: 50 μm. Red triangles represented the positive signal of specific antibodies). (H) c-Myc positive cells were analyzed (n=6). Quantitative data presented as mean ± SEM, *P < 0.05 was considered significant.
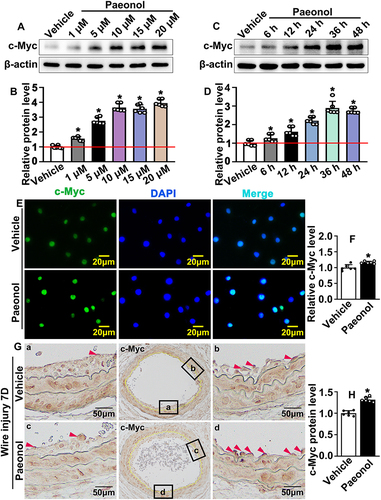
Figure 5 Paeonol actives endothelial cell VEGF signaling pathway after vascular injury. (A) The mRNA levels of VEGF signaling pathway-related genes in HUVECs after Paeonol treatment (n=6). (B) The protein level of VEGFR2 protein in HUVEC-Cs treated with Paeonol for different time points. (C) The quantification relative protein of VEGFR2 (n=6). (D) IF staining against VEGFR2 antibody performed to evaluate VEGFR2 expression in HUVEC after Paeonol treatment (Scale bar: 20 μm). (E) The quantification of the relative fluorescence intensity of VEGFR2 after Paeonol treatment (n=6). (F) IHC staining against VEGFR2 antibody performed to detect VEGFR2 expression on slides after Paeonol treatment for 7 days (Scale bar: 100 μm). (G) Integrated optical intensity analyzed (n=6). Quantitative data presented as mean ± SEM, *P < 0.05 was considered significant.
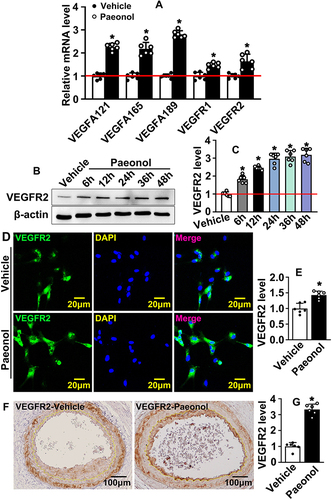
Figure 6 Paeonol induces reendothelialization by regulating interaction between c-Myc and VEGFR2 after vascular injury. (A) The interactions among c-Myc, VEGFA and VEGFR family were analysed by String Database. Nodes represent proteins while edges represent interaction. (B and C) Molecular docking simulation performed to evaluate interaction between Paeonol with c-Myc protein and VEGFR2 protein. (D) Binding affinity of Paeonol to protein c-Myc and VEGFR2 was analyzed. (E) The complex of VEGFR2 and c-Myc docking processed by ZDOCK. VEGFR2 is shown in green, c-Myc in red. (F) CO-IP was performed to evaluate the interaction between c-Myc and VEGFR2. (G) IF staining performed in HUVECs to exhibit co-localization of c-Myc and VEGFR2 (Scale bar: 20 μm).
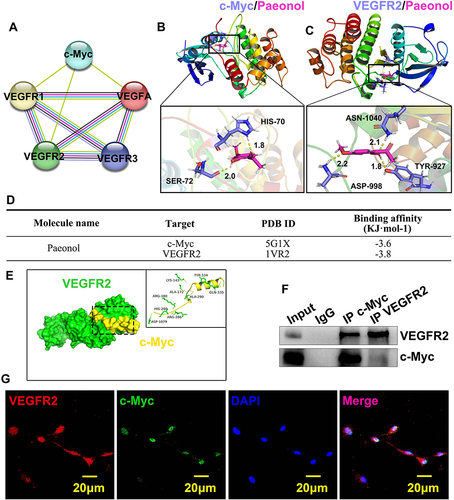
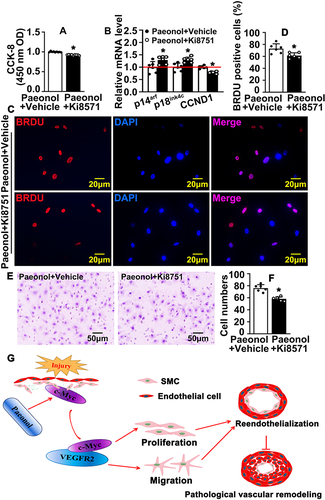
Figure 7 Inhibition of VEGF signaling pathway attenuates Paeonol associated reendothelialization. (A) HUVEC-Cs were treated with 10 μM Paeonol and 10 nM Ki8571 (VEGFR2 inhibitor), and CCK-8 performed to evaluate cell viability (n=9). (B) HUVEC-Cs were treated with Ki8751 (10 nM) after treatment with Paeonol. Real Time PCR performed to detect the relative mRNA levels of cell cycle-regulated genes (n=6). (C) HUVEC-Cs were treated with Ki8571 (10 nM) and Paeonol (10 μM) for 12 hours, after BRDU reagent labelled for 24 hours (Scale bar: 20 μm). (D) BRDU positive cells were quantified (n=6). (E) Boyden migration assay was performed after Paeonol (10 μM) and Ki8571 (10 nM) treating for 24 hours, and cell numbers were quantified in (F) (Scale bar: 50 μm; n=6). Quantitative data presented as mean ± SEM, *P < 0.05 was considered significant. (G) Schematic diagram demonstrates that how Paeonol regulates reendothelialization after vascular injury.