Figures & data
Figure 1 Flowchart of the study.
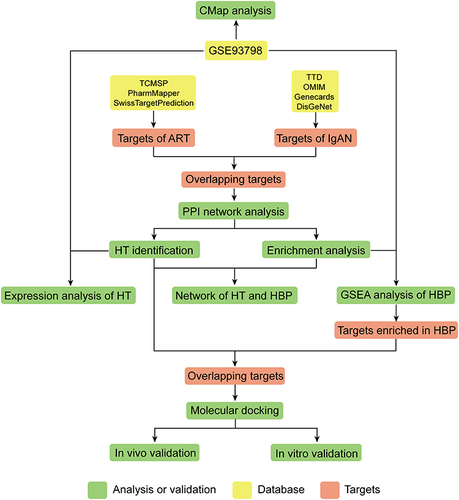
Figure 2 CMap analysis predicted the therapeutic effect of artemisinin for IgAN. (A) The chemical structure of artemisinin. (B) The bar graph shows all the output instances of different compounds in CMap analysis. The green and red edges represent positive and negative correlation with IgAN DEGs, respectively, while the red lines indicate the NCS value of artemisinin.
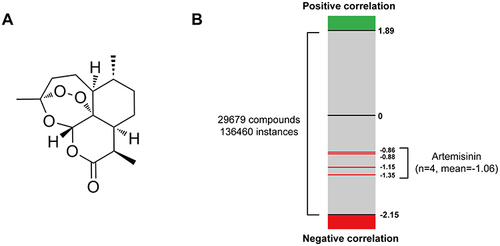
Table 1 Primers Used in the Experiments
Figure 3 PPI network construction for the targets of artemisinin against IgAN. (A) The Venn diagram identified 87 overlapping targets. (B) PPI network of the potential targets against IgAN. Nodes represent targets, and lines represent interactions between two targets. The redder and larger the node were, the higher the degree was. The redder and wider the edge were, the higher the combined score was.
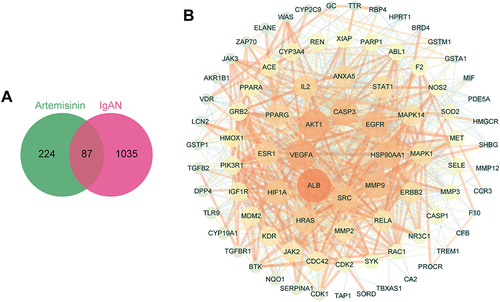
Figure 4 Crucial clusters and hub targets identification. (A) Three crucial clusters of the PPI using MCODE plugin, with the score below. (B) Top 15 hub genes were screened by CytoHubba plugin. The bar chart represents degree value, while the dot and line chart represents CytoHubba score of MCC methods. (C) Volcano Plot showed the expression level and P value of the hub genes in the gene set GSE93798. The arrows of AKT1 and SRC overlapped.
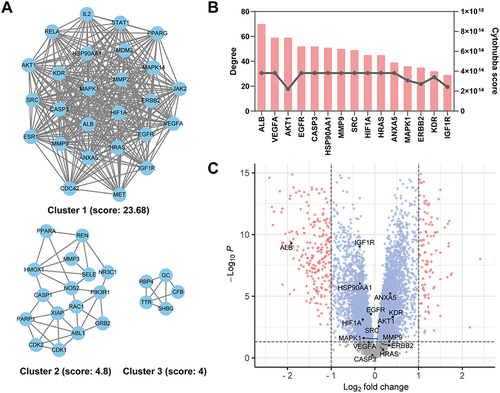
Figure 5 Enrichment analysis of potential targets. GO biological process (BP) (A), molecular function (MF) (B), cellular component (CC) (C) and KEGG pathway (D) enrichment analysis for potential targets of artemisinin against IgAN. (E) Compound-target-biological process interaction network. The green rhombus nodes indicate the top 10 biological processes, the blue circular nodes indicate 15 hub targets, the red rectangle node represents artemisinin. (F) The Sankey diagram showed the interaction and each count of 15 hub targets and 6 top biological processes.
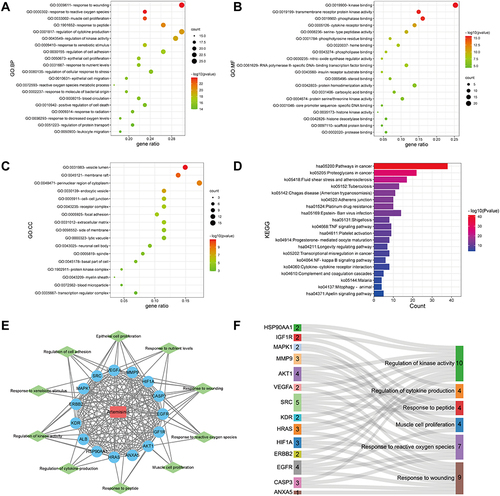
Figure 6 Response to ROS is the crucial biological process of artemisinin against IgAN. (A) Gene set enrichment analysis (GSEA) of 6 hub biological processes in GSE93798 (Normal versus disease). The color of each legend on the right consists with the biological process curve above. NES and nominal p-value are shown in the legend. (B) Total and internal degrees of all the targets involved in response to ROS. (C) Network of these enriched targets. The redder the node was, the higher the degree was. (D) The Venn diagram identified an overlap of 7 targets between the hub targets and targets response to ROS.
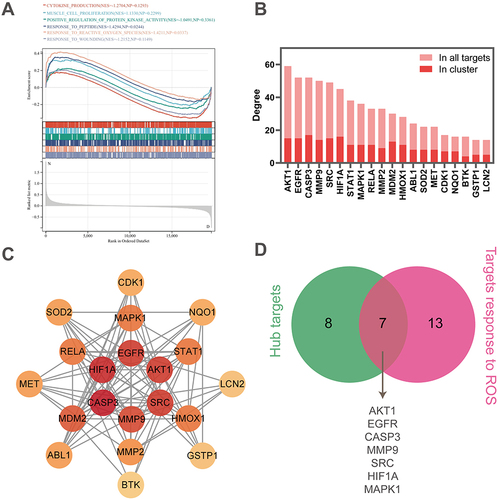
Table 2 The Binding Affinity of Artemisinin with Proteins
Figure 7 Molecular docking of targets with artemisinin. (A) The binding affinity of artemisinin docking with 7 targets. The redder the bar was, the lower the affinity was. 3D docking structure and interactions of artemisinin binding to AKT1 (B) and EGFR (C). 2D interaction diagrams of artemisinin docking with AKT1 (D) and EGFR (E).
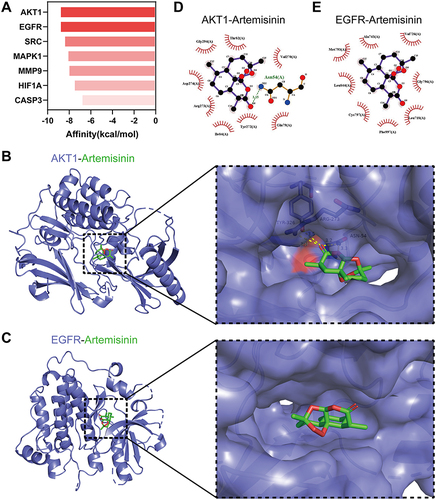
Figure 8 Effects of Artemisinin on renal function related parameters and histopathological. (A) Urinary albumin creatinine ratio (ACR). (B) Serum creatinine. (C) Blood urea nitrogen (BUN). (D) IgA immunofluorescence of renal tissue. (E) PAS staining of renal tissue. White arrows indicate mesangial cell proliferation and extracellular matrix increase. (All data are presented as mean ± SD. ##p<0.01, ###p<0.001: compared with the control group; *p<0.05, **p <0.01: compared with the model group).
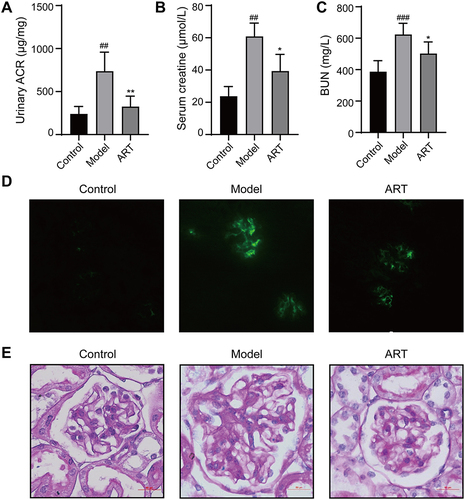
Figure 9 Artemisinin suppressed the production of Malondialdehyde and extracellular matrix in the renal cortex of mice. (A) Effect of artemisinin on Malondialdehyde (MDA). (B) Real-time PCR analysis was used to assess the mRNA levels of FN, LN, Col4, α-SMA and TGF-β. (All data are presented as mean ± SD. #p<0.05, ##p<0.01: compared with the control group; *p<0.05, **p<0.01: compared with the model group).
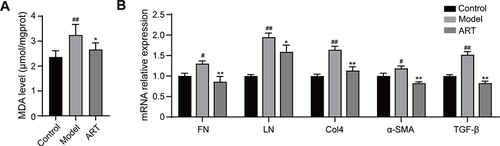
Figure 10 Artemisinin suppressed the production of reactive oxygen species and extracellular matrix of mesangial cells. (A) The viability of mesangial cells treated with artemisinin (0, 1.5, 3, 6.12, 25, 50 μM) was determined by Cell Counting Kit-8 assay. (B and C) Intracellular ROS was determined by flow cytometry assays. (D) Real-time PCR analysis was used to assess the mRNA levels of FN, LN, Col4. (All data are presented as mean ± SD. #p<0.05, ##p<0.01: compared with the control group; *p<0.05, **p<0.01: compared with the LPS group).
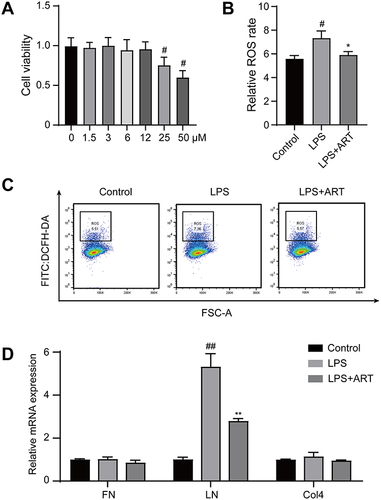
Figure 11 Artemisinin active AKT/Nrf2 pathway in mesangial cell. (A and B) Western blot analysis of p-AKT/AKT. (C–E) Western blot analysis of Nrf2 in cytoplasmic and nuclear. (F) Nrf2 Immunofluorescence of mesangial cells. (All data are presented as mean ± SD. #p<0.05, ##p<0.01: compared with the LPS group).
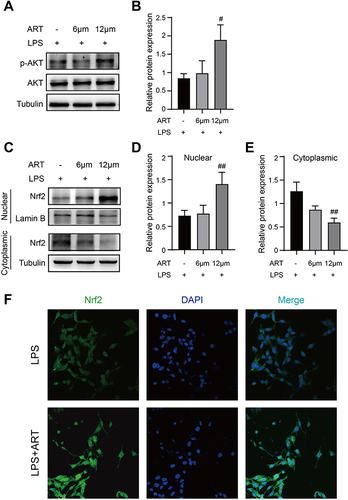
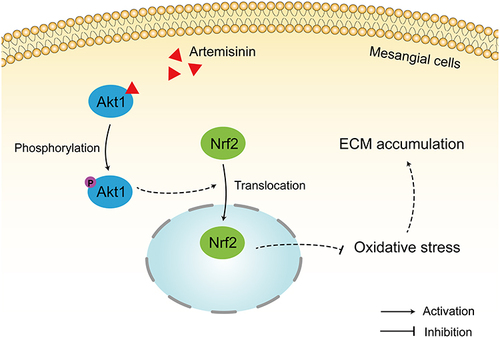
Figure 12 Artemisinin protects mesangial cells from oxidative damage of IgAN via activation of AKT/Nrf2 pathway.