Figures & data
Figure 1 Active ingredient-NS Target Network (A) Intersection SQG-related targets with NS targets; (B) The drug-bioactive ingredient gene-disease network of SQG for NS. Herbs share overlapped ingredients, labeled as A1- A5. A1 is for beta-sitosterol; A2 is for sitosterol; A3 is for Stigmasterol; A4 is for hederagenin; A5 is for quercetin.
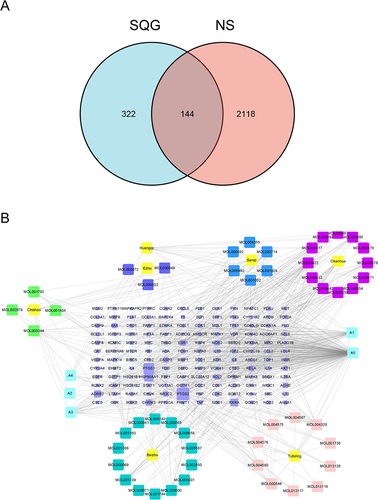
Figure 2 The PPI network based on SQG-NS common targets. Overlapping proteins are marked as nodes in this network and the interactions between the proteins are labeled as lines connecting nodes. The bigger nodes represent higher degree with darker color.
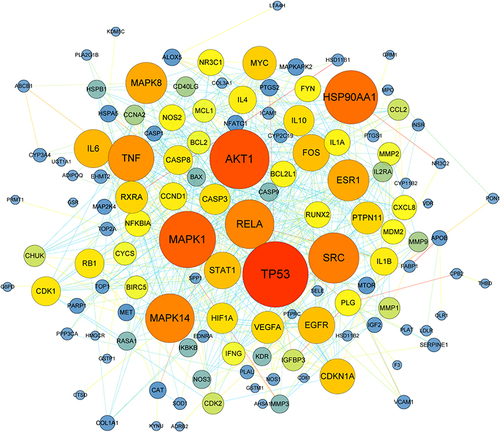
Figure 3 GO and pathway enrichment analysis of SQG active components in the treatment of common targets of NS. (A) The GO enrichment analysis. (B) KEGG pathway enrichment analysis.
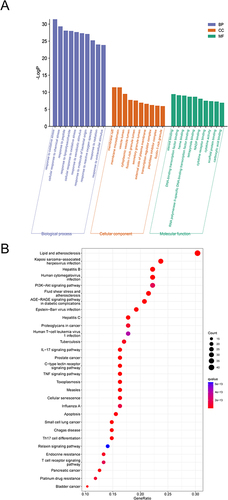
Figure 4 SQG ameliorated indicators of kidney function and pathological lesions in NS rat. (A–E) The biochemical indicators of urine and blood after 4 weeks of SQG treatment. (A) 24 hours urine protein quantitation (B) Serum creatinine concentration (C) Serum urea nitrogen concentrations (D) Serum total cholesterol concentrations (E) Serum total triglyceride concentrations (F) Serum low-density lipoprotein cholesterol concentrations (G) Representative images of H&E-stained sections of the kidney (scale bar: 50 μm). Data in (A–E) are presented as the mean ± s.d. *p < 0.05, ***p < 0.001, ****p < 0.0001, vs Control group. #p < 0.05, ##p < 0.01, ###p < 0.001, ####p < 0.0001, vs Model group. n = 6 samples per group.
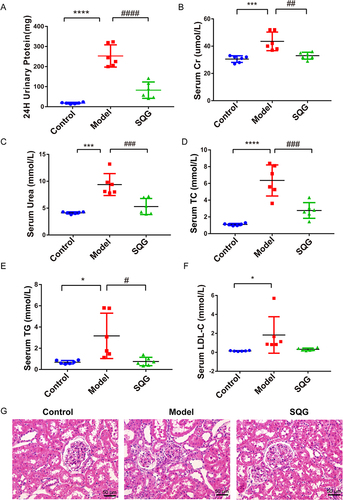
Figure 5 SQG ameliorates glomerular podocyte damage in NS rats, nephrin and podocin expression as examples. (A) Nephrin immunohistochemical staining images (scale bar: 50μm and 20μm). (B) Immunohistochemistry analysis of Nephrin. (C–E) Representative Western blot analysis of nephrin and podocin levels in kidney tissue. Data are presented as the mean ± s.d. ***p < 0.001, ****p < 0.0001, vs Control group. ##p < 0.01, ####p < 0.0001, vs Model group. n = 3 samples per group.
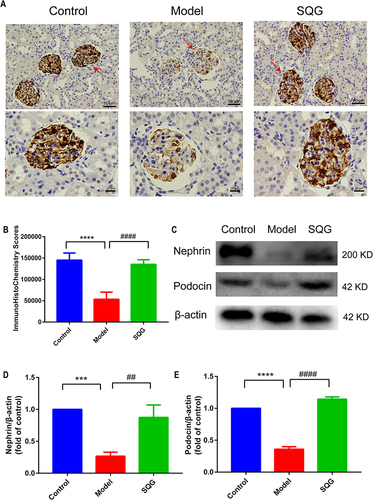
Figure 6 SQG blunted the activation of the apoptosis pathway and inhibited kidney cells apoptosis in NS rats. (A). Kidney slices were stained by TUNEL assay (scale bar: 100μm). (B) Fluorescent intensity analysis of the TUNEL staining. (C–E) Representative Western blot analysis of Bax, Bcl-2 levels in kidney tissue. Data are represented as mean ± s.d. from independent groups. *p < 0.05, ****p < 0.0001, vs control group. #p < 0.01, ####p < 0.0001, vs Model group. n = 3 samples per group.
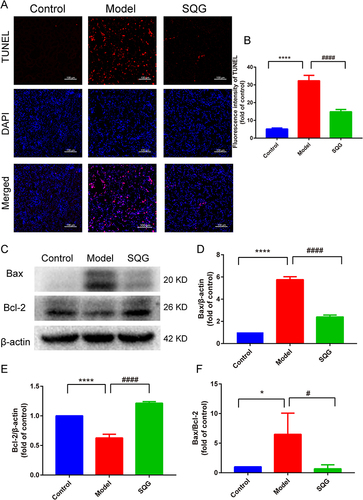
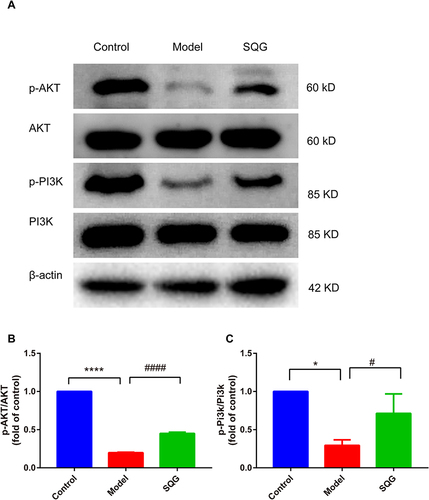
Figure 7 SQG activated PI3K/AKT signaling pathway against NS. (A) Expressions of protein AKT, p-AKT, PI3K and p-PI3K were determined by Western blotting. (B) Quantitative analysis of p-AKT/AKT expression ratio. (C) Quantitative analysis of p-PI3K/PI3K ratio. Data are shown as mean ± s.d. *p < 0.05, ****p < 0.0001, vs Control group. #p < 0.05, ####p < 0.0001 vs Model group. n=3 samples per group.