Figures & data
Table 1 Results before bronchoalveolar lavage at 3 hours and 5 hours after surfactant treatment in twelve rabbits
Figure 1 Time profile for oxygenation in the rabbit groups, as reflected by the arterial PaO2 and a/A ratio after surfactant administration.
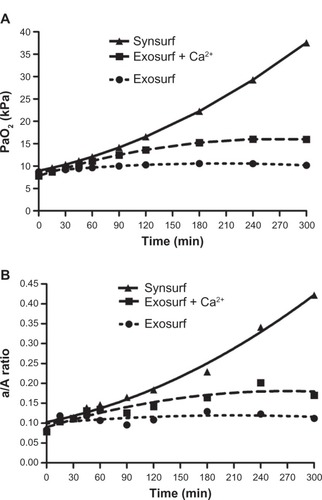
Figure 2 Time profile of pulmonary shunt after administration of surfactant in rabbit groups.
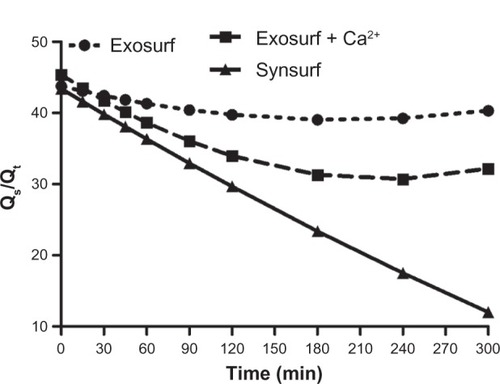
Figure 3 Compliance of the respiratory system: time-profile comparison of rabbit groups prelavage and after surfactant administration.
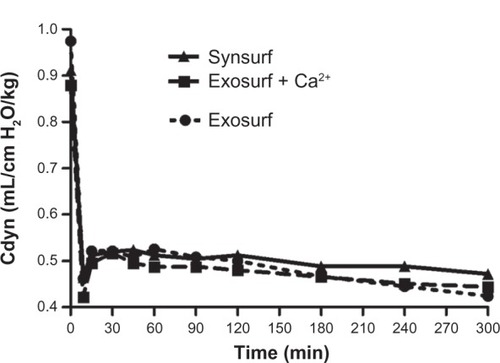
Figure 4 Time profile of (A) alveolar dead space/tidal volume ratio (VDalv/VT), (B) dead space/tidal volume ratio (VD/VT), and (C) arterial end-tidal PCO2 difference before and after surfactant administration.
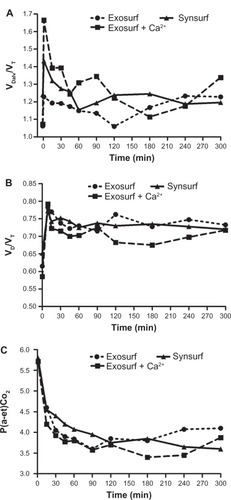
Table 2 Relation between arterial/alveolar PO2 ratio and dead-space components
Table 3 Relation between arterial end-tidal PCO2 difference and dead-space components