Figures & data
Table 1 The Primer Sequences
Figure 1 The physiological outcomes of APS in the treatment of DN rats. (A) Fasting blood glucose levels. (B) Body weight. (C) Ratio of kidney weight to body weight. **P<0.01 vs control, ##P<0.01 vs model.
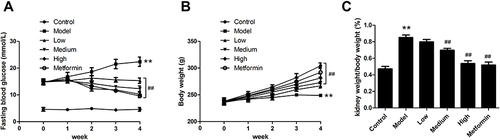
Figure 2 Effects of APS treatment on renal function. (A) Serum creatinine. (B) Blood urea nitrogen. (C) 24 h urinary protein. **P<0.01 vs control, ##P<0.01 vs model.
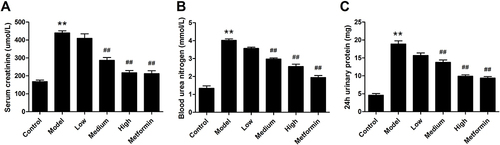
Figure 3 Effects of APS on the pathological lesions in the kidneys of DN rats (×200). (A) Control. (B) Model. (C) Low. (D) Medium. (E) High. (F) Metformin.
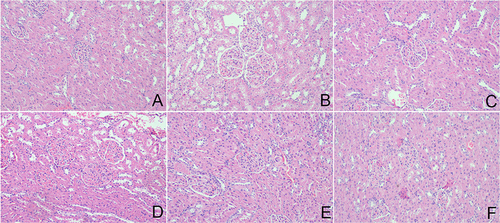
Figure 4 APS promotes HG-induced podocytes growth and cell cycle progression. (A) APS medicated serum with different concentrations. (B) Cell viability at different culture times. (C and D) Flow cytometric detection of cell cycle distribution and proliferation. **P<0.01 vs control, ##P<0.01 vs model.
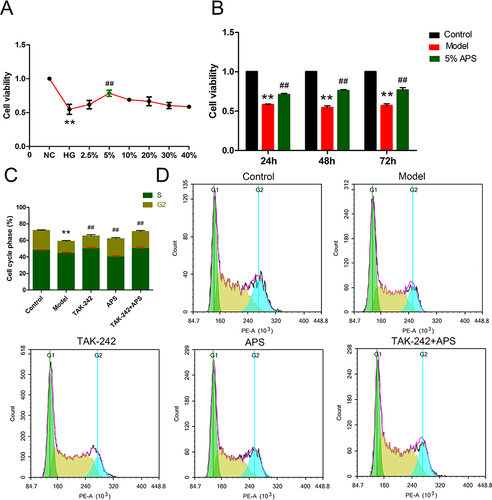
Figure 5 Effects of APS treatment on renal inflammatory responses. (A and D) IL-1β. (B and E) IL-6. (C and F) MCP-1. **P<0.01 vs control, ##P<0.01 vs model.
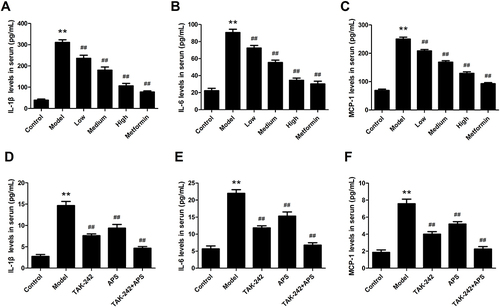
Figure 6 Effects of APS on the mRNA expression of TLR4, p65 and IκBα. (A and D) TLR4. (B and E) p65. (C and F) IκBα. **P<0.01 vs control, ##P<0.01 vs model.
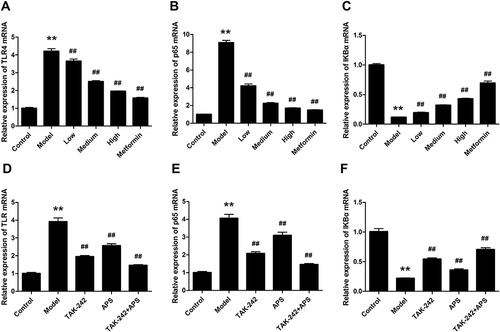
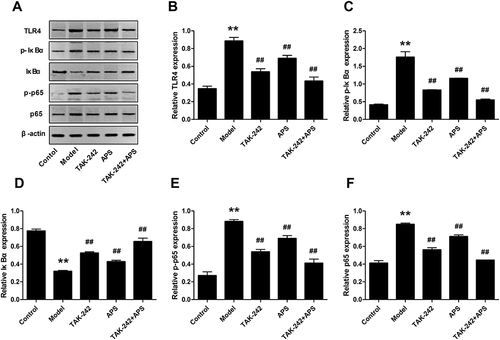
Figure 7 Effects of APS on the expression of TLR4/NF-κB pathway in DN rats. (A) Western blotting for the protein of TLR4/NF-κB pathway. (B–F) TLR4, p-IκBα, IκBα, p-p65 and p65. **P<0.01 vs control, #P<0.05; ##P<0.01 vs model.
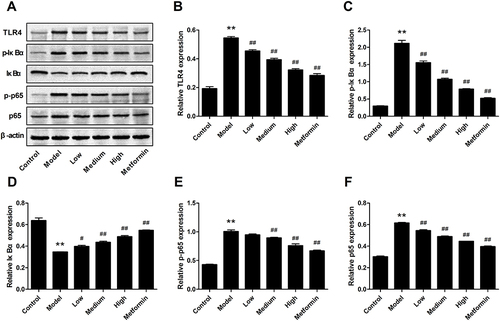
Figure 8 Effects of APS on the expression of TLR4/NF-κB pathway in HG-induced podocytes. (A) Western blotting for the protein of TLR4/NF-κB pathway. (B–F) TLR4, p-IκBα, IκBα, p-p65 and p65. **P<0.01 vs control, ##P<0.01 vs model.