Figures & data
Figure 1 Schematic calculation of descriptors set encoding hypromellose.
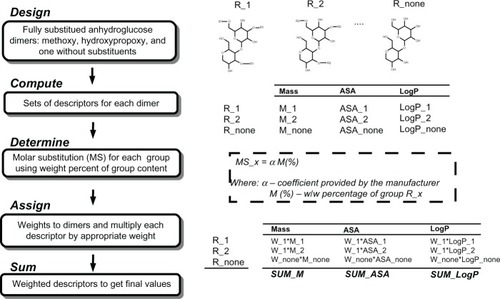
Figure 2 Chemoinformatic description of the excipients included into the native input vector.
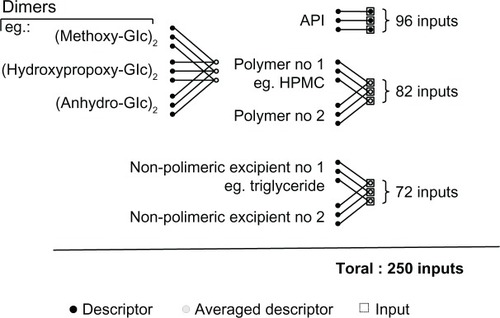
Figure 3 General structure of artificial neural network models.
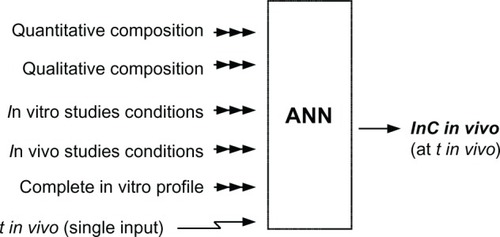
Table 1 General description of the native input vector
Figure 4 Results of sensitivity analysis for the most important 28 inputs, with relative importance computed in the context of the native dataset.
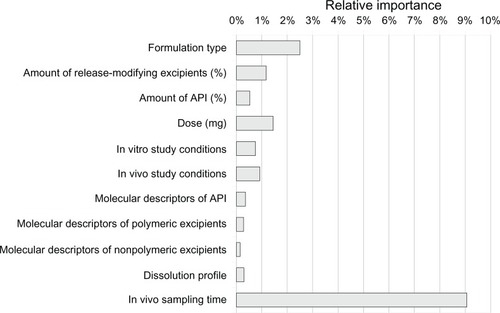
Table 2 Input vector reduced to 28 governing variables
Table 3 Architecture of ANNs selected for expert committee and their generalization errors
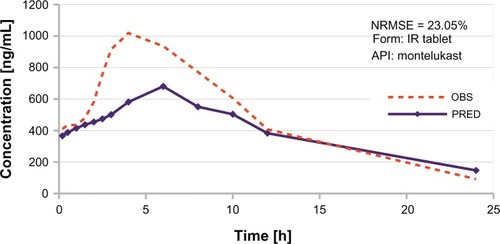
Figure 5 Examples of in vivo profile predictions.
Abbreviations: API, active pharmaceutical ingredient; IR, immediate release formulation; MR, modified release formulation; NRMSE, normalized root mean squared error; OBS, observed profile; PRED, profile predicted by the neural model.
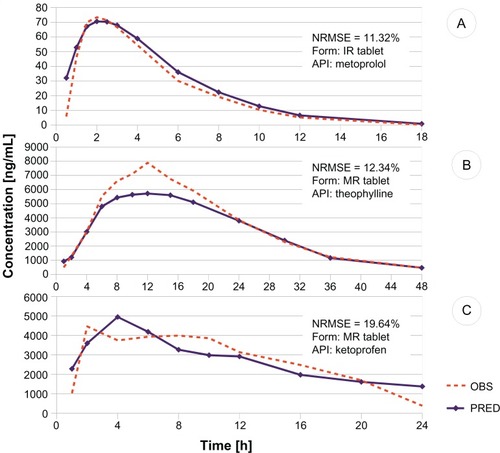
Figure 6 Example of in vivo profile prediction for the new test dataset introduced after the model development phase.
Abbreviations: API, active pharmaceutical ingredient; IR, immediate release formulation; NRMSE, normalized root mean squared error; OBS, observed profile; PRED, profile predicted by the neural model.