Figures & data

Table 1 Herbal Formula of QBD
Table 2 Primer Sequences Used for qPCR Analysis
Table 3 Antibodies Used for WB Analysis
Figure 1 The total ion chromatograms of the QBD by UPLC-Q/TOF-MS/MS. (A) The positive-ion mode. (B) The negative-ion modes.
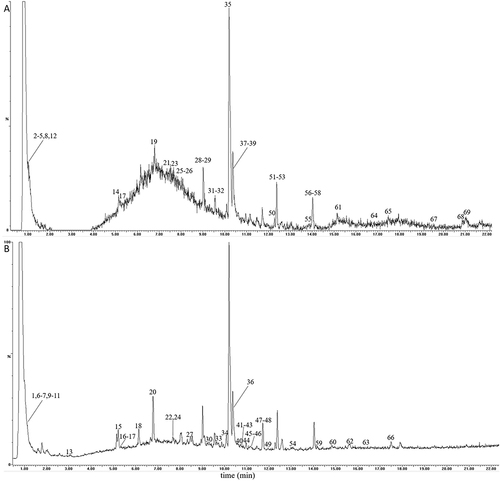
Figure 2 In vivo anti-tumor efficacy of QBD on H1299 cells. (A) Mortality of larval zebrafish treated with QBD at a dose of 0, 62.5, 125, 250, 500, 1000, 2000, and 4000 μg/mL, respectively, for 24 h. (B) The fluorescence intensity and inhibitory rates of QBD. (C) Observations of H1299 xenograft zebrafish after 24 h treatment of QBD (0, 125, 250, and 500 μg/mL) or DDP (22.5 μg/mL). The fluorescence area in red represented the H1299 cell’s mass. Values were presented as the mean ± SD, *P < 0.05, **P < 0.01, and ***P < 0.001 vs control group.
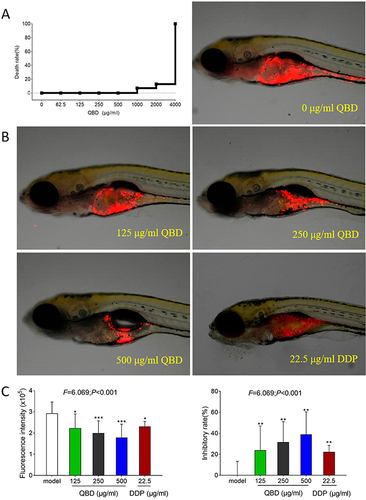
Figure 3 In vitro pro-apoptotic effects of QBD (0, 1.5, 2.25, and 3 mg/mL) on H1299 cells. (A) Morphological observation of H1299 cells treated with QBD (0, 1.5, 2.25, and 3 mg/mL) or DDP (22.5 μg/mL) for 24 h. (B) Cell viability of H1299 cells treated with QBD (0, 1, 1.5, 2, 3, and 4 mg/mL) for 24 and 48 h. (C) DAPI staining, TUNEL assay observations of H1299 cells after 24 h treatment of QBD (0, 1.5, 2.25, and 3 mg/mL) or DDP (22.5 μg/mL), with white arrows indicating TUNEL positive cells. (D) Flow cytometry analysis of H1299 cells after 24 h treatment of QBD (0, 1.5, 2.25, and 3 mg/mL) or DDP (22.5 μg/mL) and the statistical analyses of the apoptotic rate. LL: FITC-Annexin V and PI negative; LR: FITC-Annexin V positive; UR: FITC-Annexin V and PI positive; UL: PI positive, Values were presented as the mean ± SD, *P < 0.05, **P < 0.01, and ***P < 0.001 vs control group. Scale bar: 50 μm.
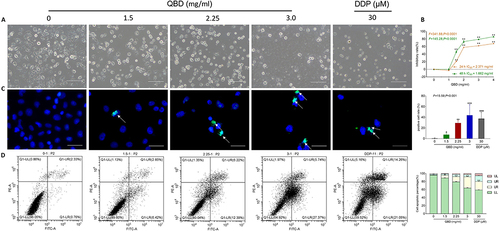
Figure 4 QBD (0, 1.5, 2.25, and 3 mg/mL) induced apoptosis in H1299 cells. (A) Relative mRNA expression of apoptosis-related genes in H1299 cells treated with QBD (0, 1.5, 2.25, and 3 mg/mL) or DDP (22.5 μg/mL) for 24 h. (B) Western blot analysis of related protein expressions in H1299 cells treated with QBD (0, 1.5, 2.25, and 3 mg/mL) or DDP (22.5 μg/mL) for 24 h. (C) The statistical analyses of the relative protein expressions. Data are presented as mean ± SD (n = 3). *P < 0.05, and **P < 0.01 vs control group.
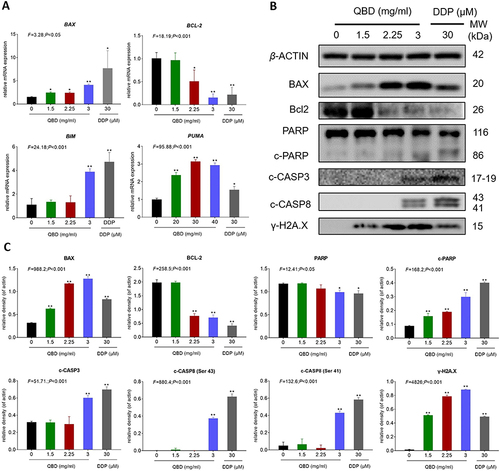
Figure 5 Efficacy of ART B on H1299 cell viability and pro-apoptotic effects. (A) Morphological observations of H1299 cells with different doses of ART B (0, 20, 30, and 40 μM) or DDP (30 μM) treatment for 24 h. (B) Apoptosis analysis with annexin V-FITC/PI staining by flow cytometry in H1299 cells with ART B (0, 20, 30, and 40 μM) or DDP (30 μM) treatment for 24 h, displaying the apoptosis rates at early and late-stage. (C) Viability of H1299 induced by ART B (0, 10, 16, 22, 28, 34, and 40 μM) for 24 h. (D) Viability of H1299 induced by artemisinic acid (0, 100, 200, 300, 400, 500 μM) for 24 h. (E) The statistical analyses of the apoptotic rate. LL: FITC-Annexin V and PI negative; LR: FITC-Annexin V positive; UR: FITC-Annexin V and PI positive; UL: PI positive. (F) Early apoptosis of ART B on H1299 cells treated with ART B (0, 20, 30, and 40 μM) or DDP (30 μM). (G) Late apoptosis of ART B on H1299 cells treated with ART B (0, 20, 30, and 40 μM) or DDP (30 μM). Data are presented as mean ± SD (n = 3), **P < 0.01 vs control group. Scale bar: 50 μm.
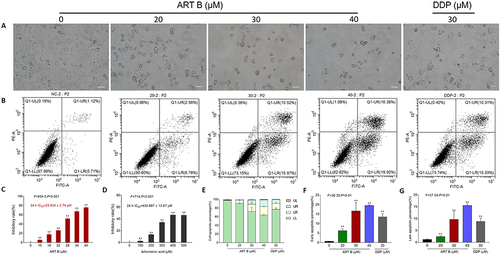
Figure 6 In vitro pro-apoptotic effects of ART B on H1299 cells for 24 h. (A) DAPI, TUNEL, and γ-H2A.X immunofluorescence observations of H1299 cells after 24 h treatment of ART B (0, 20, 30, and 40 μM) or DDP (30 μM). White arrows in the top row indicate the abnormal shape of the nucleus, white arrows in the middle row indicate apoptosis positive cells, and white arrows in the bottom row indicate γ-H2A.X positive cells. (B) Statistical data. Data are presented as mean ± SD (n = 3), **P < 0.01, and ***P < 0.001 vs control group. Scale bar: 50 μm.
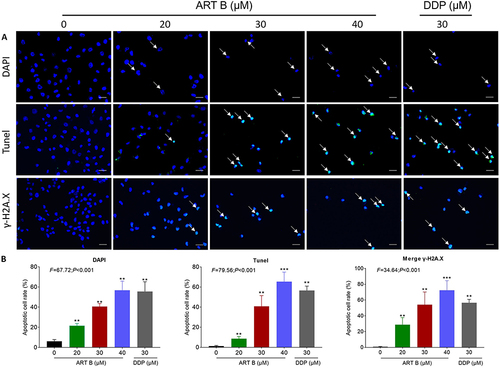
Figure 7 Network pharmacology of ART B in lung cancer. (A) Venn diagram summarizing the intersection of targets of ART B and lung cancer. The purple circle and the yellow circle represent targets of ART B and lung cancer, respectively. (B) The network of ingredient-target-disease. ART B on the left rings, and 204 target genes (right rectangles). (C) The top 30 of KEGG enrichment analysis. The red and blue bars reflect the P value, the redder the color, the smaller the P value. The red underline indicates that ART B is strongly associated with PI3K/Akt signal pathway. (D) PPI network of the potential protein targets of ART B for the treatment of lung cancer. The yellow rectangles represent core proteins, and the blue rectangles represent non-core proteins. (E) Significant anti-lung cancer protein targets after BC, CC, DC, EC, LAC, NC screenings in (D). The yellow rectangles represent core proteins, and the blue rectangles represent non-core proteins. (F) 24 core proteins of ART B for the treatment lung cancer screening from BC, CC, DC, EC, LAC, NC in (E).
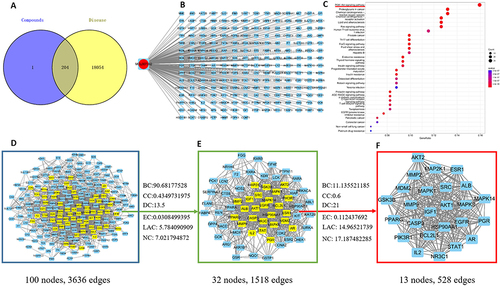
Figure 8 Pro-apoptotic-genes expression evaluated by qPCR in H1299 cells with ART B (0, 20, 30, and 40 μM) or DDP (30 μM) treatment for 24 h. Data are presented as mean ± SD (n = 3), *P < 0.05, **P < 0.01, and ***P < 0.001 vs control group; ns, P > 0.05 vs control group.
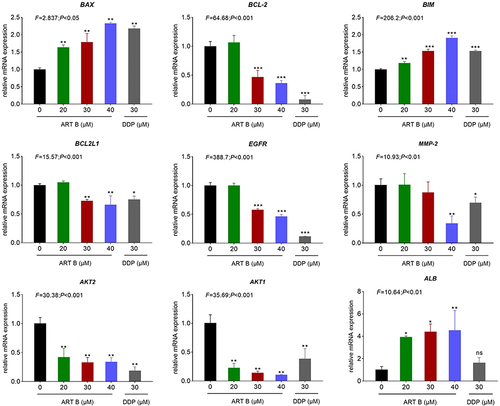
Figure 9 ART B (0, 20, 30, and 40 μM) induced apoptosis in H1299 cells. (A) Western blot analysis of related protein expressions of p-PI3K, PI3K, Akt, p-Akt, BAX, BCL-2, PARP, c-PARP, c-CASP3, and γ-H2A.X in H1299 cells with ART B (0, 20, 30, and 40 μM) or DDP (30 μM) treatment for 24 h. (B) The statistical analyses of the related protein expressions. Data are presented as mean ± SD (n = 3), *P < 0.05, **P < 0.01 vs, and ***P < 0.01 vs control group.
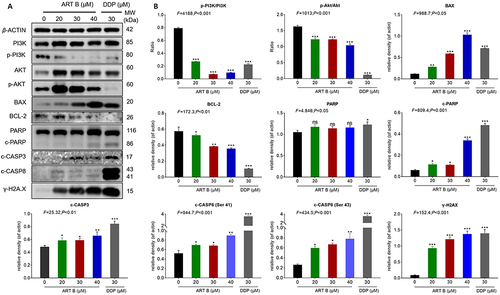
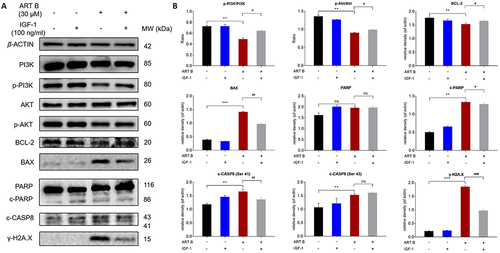
Figure 10 IGF-1 reversed ART B-induced apoptosis in H1299 cells. Cells were treated with ART B (30 μM) with or without IGF-1 (100 ng/mL) for 24 h. (A) The expression of PI3K, p-PI3K, Akt, p-Akt, BCL-2, BAX, PARP, c-PARP, c-CASP8, γ-H2A.X in H1299 cells were detected by Western blotting. (B) The statistical analyses of the related protein expressions. β-ACTIN was used as an internal control. Data are presented as mean ± SD (n = 3), **P < 0.01, and ***P < 0.001 vs control group. #P < 0.05, ##P < 0.01, and ###P < 0.001 vs the ART B treatment group. ns, P > 0.05 vs control group or the ART B treatment group.