Figures & data
Figure 1 The methodology diagram of cell experimental.
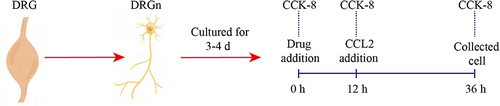
Figure 2 The methodology diagram of animal experimental.
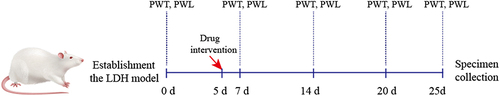
Figure 3 Network pharmacology analysis. (A) Drug-disease target network construction. (B) PPI network of potential target. (C) GO enrichment analysis. (D) KEGG pathway enrichment analysis.
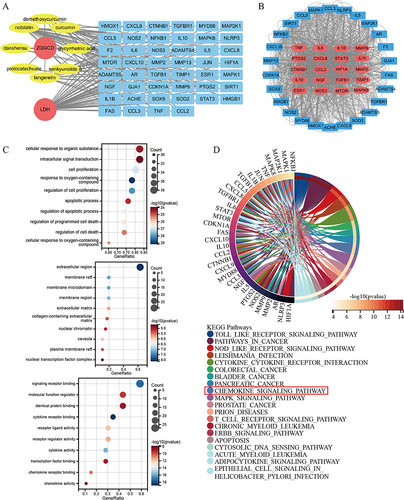
Figure 4 CCL2 induces the expression of CCR2 and ASIC3 in DRGn, which is inhibited by CCR2 inhibitors and ZQGCD containing serum (A) The cell viability of DRGn. After 12 h pretreatment with RS504393 and ZQGCD containing serum (5%, 10%, and 15%), there was no change in cell viability (P>0.05). After adding CCL2 for 24 h, the viability of unpretreated cells decreased significantly (P<0.05), while that of pretreated DRGn did not change compared with the control group (P>0.05). (B) Expression of CCR2 and ASIC3 mRNA in DRGn. (C and D) Expression of CCR2 and ASIC3 proteins in DRGn. **P<0.01, ***P<0.001, ****P<0.0001, ns: P>0.05.
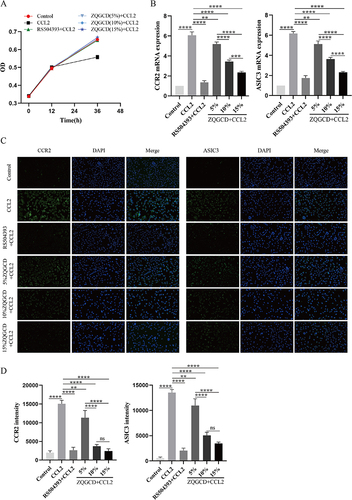
Figure 5 CCR2 inhibitors and ZQGCD containing serum can inhibit the increased excitability of DRGn induced by CCL/CCR2 signaling pathway. (A) Intracellular cationic Ca2+ content. (B) DRGn cell membrane potential. *P<0.05, ***P<0.001, ****P<0.0001, ns: P>0.05.
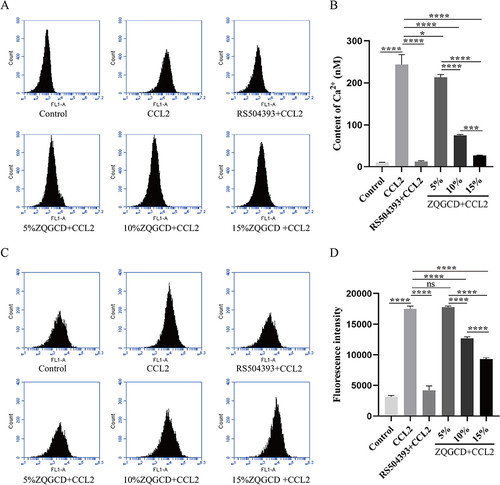
Figure 6 CCR2 inhibitor or ZQGCD can improve hyperalgesia of LDH rats. (A) Paw withdrawal threshold in rats. Compared with sham rats, PWT in LDH rats was significantly lower on day 7 after NP implantation (P<0.0001). After RS504394 and ZQGCD (6 g/kg, 12g/kg) treatment, the PWT of rats was lower than that of LDH rats at 25 days after NP implantation (P<0.001, P<0.0001). (B) Paw withdrawal latency in rats. Compared with sham rats, the PWL in LDH rats was significantly lower on day 7 after NP implantation (P<0.0001). After RS504394 and ZQGCD (3 g/kg, 6g/kg, 12 g/kg) treatment, the PWL of rats was lower than that of LDH rats at 25 days after NP implantation (P<0.001, P<0.0001, P<0.0001).
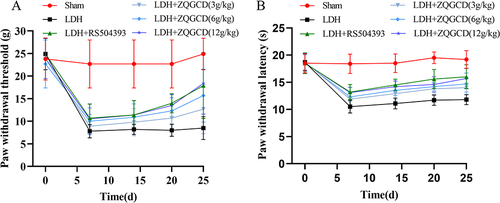
Figure 7 CCR2 inhibitor or ZQGCD improved intervertebral disc degeneration and inhibited serum inflammatory cytokines expression in LDH rats. (A) Representative HE-stained intervertebral disc sections (magnification: 10× or 40×). (B) Intervertebral disc histopathologic score. (C) Comparison of serum inflammatory cytokines CCL2, IL-1β, IL-6, and TNF-α. *P<0.05, **P<0.01, ****P<0.0001, ns: P>0.05.
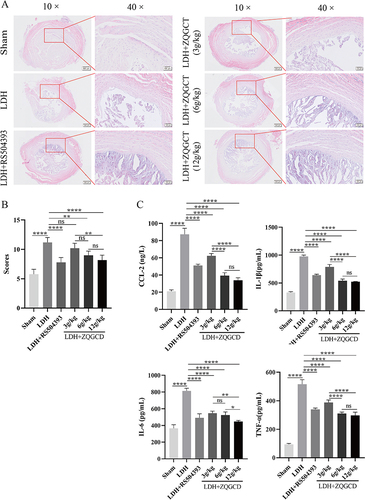
Figure 8 The expression of CCL2/CCR2 pathway in the intervertebral disc of LDH rats was increased, but CCR2 inhibitors or ZQGCD inhibited this expression. (A and B) Representative images (magnification: 40x) and semi-quantitative histogram of immunohistochemical staining of CCL2 protein of intervertebral disc. (C and D) Representative images (magnification: 40x) and semi-quantitative histogram of immunohistochemical staining of CCR2 protein of intervertebral disc. *P<0.05, **P<0.01, ***P<0.001, ****P<0.0001, ns: P>0.05.
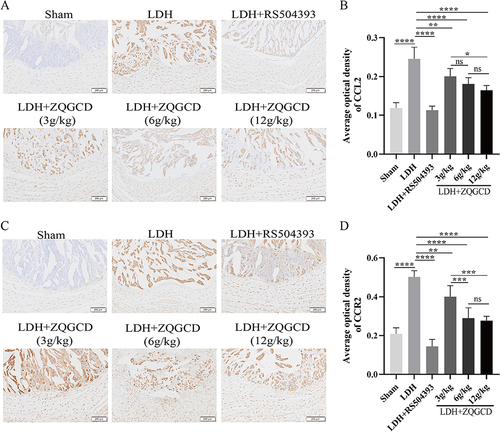
Figure 9 CCL2/CCR2 pathway and ASIC3 were highly in DRG of LDH rats expressed but inhibited by CCR2 inhibitor or ZQGCD. (A) Bar graphs showing the expression levels of CCL2 and CCR2 mRNA in DRG. (B and C) Immunoblot and bar graphs showing the expression levels of CCL2 and CCR2 in DRG. *P<0.05, **P<0.01, ****P<0.0001, ns: P>0.05.
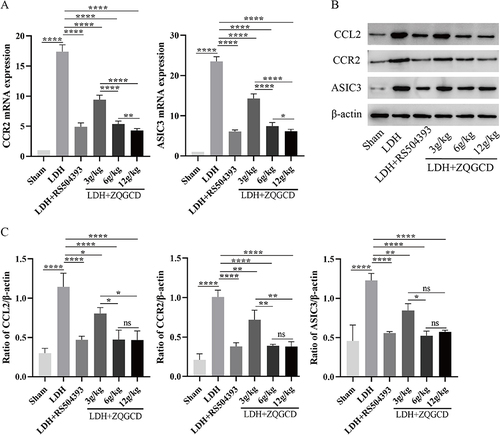
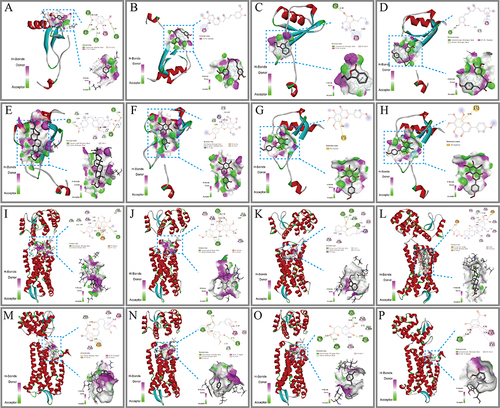
Figure 10 Molecular docking of CCR2 with compounds in blood. (A-H) The binding poses of CCL2 with nobiletin, tangeretin, senkyunolide A, glycyrrhetinic acid, glycyrrhizic acid, curcumin, demethoxycurcumin, danshensu, and protocatechuate. (I-P) The binding poses of CCR2 with nobiletin, tangeretin, senkyunolide A, glycyrrhetinic acid, glycyrrhizic acid, curcumin, demethoxycurcumin, danshensu, and protocatechuate. In the two-dimensional diagram, the green dashed lines represent hydrogen bonds, the light green dashed lines represent carbon-hydrogen bonds, and the pink-brown and purple dashed lines represent hydrophobic forces.