
Figures & data
Figure 1 Effect of Ber, Pal and Ber/Pal combined treatment on neuroinflammation in vitro and behaviour in APP/PS1 mice. (A) The NO concentration in LPS-stimulated (250 ng/mL) microglia was detected with the Griess method. (B–E) Inflammatory cytokine detection of TNF-α, IL-1β, IL-4 and IL-10. Inflammatory cytokines in microglia stimulated by Aβ25-35 (20 μM) after coincubation with Ber, Pal, Ber/Pal, Exos and Exos-Ber/Pal for 24 h. The microglia were stimulated with LPS/Aβ25-35 for 1 h in advance. The concentration of Ber/Pal was 0.3 μM. (F) Schematic illustration of the experiment. (G) The escape latency time, (H) platform crossing times, and (I) target quadrant occupancy in the MWM. (J) Representative motion trajectories in the MWM. i, the first quadrant of MWM; ii, the second quadrant of MWM; iii, the third quadrants of MWM; iv, the fourth quadrants of MWM. (K) OLT performance of mice administered different formulations. WT indicates wild-type control mice without any gene intervention. APP/PS1 indicates the AD model mice. The Ber/Pal injection dosage was 1.22/1.52 mg/kg. (A), n = 3; (B–E), n = 6. (F–K), n = 8. *p < 0.05, **p < 0.01.
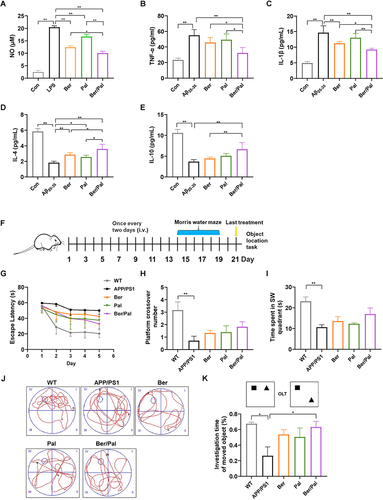
Figure 2 Effect of Ber, Pal and Ber/Pal combined treatment on neuronal recovery in APP/PS1 mice. (A) Immunofluorescence staining of NeuN-positive cells and (B and C) NeuN-positive cell counting in the hippocampus and cortex. (D) Immunofluorescence observation and (E–G) semiquantitative data of PSD95 in the CA1, CA3 and cortex. WT indicates wild-type control mice without any gene intervention. APP/PS1 indicates the AD model mice. The Ber/Pal injection dosage was 1.22/1.52 mg/kg. The scale bar for (A) is 100 μm (hippocampus) and 20 μm (cortex). The scale bar for (D) is 20 μm. n = 3. *p < 0.05, **p < 0.01.
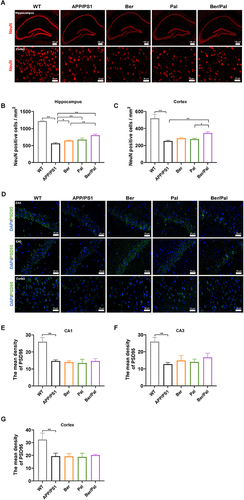
Figure 3 Inhibition of Aβ pathology and neuroinflammation in APP/PS1 mice. Immunofluorescence staining observation of (A) Th-S (Aβ) and (B) IBA-1 in the hippocampus. Quantitative analysis of (C) Aβ and (D) IBA-1. (E–G) Concentration determination of Aβ42 and Aβ40 and the ratio of Aβ42/Aβ40 in the hippocampus by ELISA. (H–K) Inflammatory cytokine detection in the hippocampus. WT indicates wild-type control mice without any gene intervention. APP/PS1 indicates the AD model mice. The Ber/Pal injection dosage was 1.22/1.52 mg/kg. The scale bar is 100 μm. (A–D), n = 3. (E–K), n = 5. *p < 0.05, **p < 0.01.
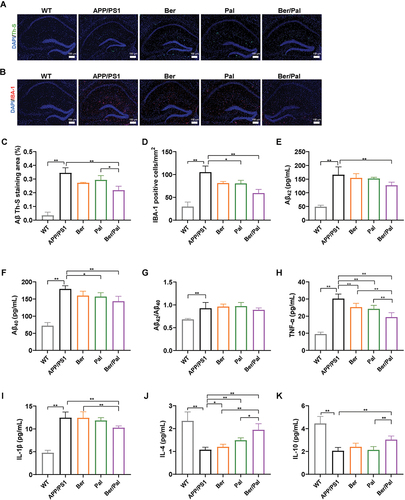
Table 1 Loading Efficiency of Incubation, Freeze-Thaw Cycles and Ultrasound
Figure 4 Characterization of Exos and Exos-Ber/Pal. (A and B) The particle size distribution of Exos and Exos-Ber/Pal. (C) Zeta potential. (D) TEM determination. (E) WB analysis of protein markers (CD63 and TSG101) in Exos and Exos-Ber/Pal. (F) Cumulative drug release from Exos-Ber/Pal in 48 h. The scale bar is 100 nm. n = 3.
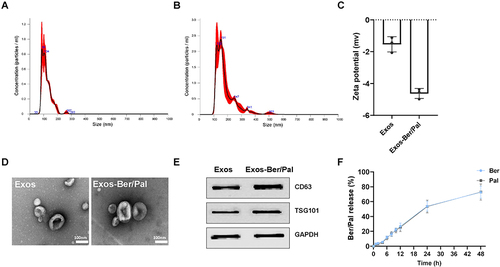
Figure 5 Distribution and targeting of Exos-Ber/Pal in vitro and vivo. (A) Parent cell targeting ability. Fluorescence images were observed by optimal microscopy. PKH26-labelled Exos were respectively incubated with BV2 and SH cells for 3 h. (B) Cellular uptake of PKH26-labelled Exos after incubation with BV2 cells for 0.5, 1 h and 3 h. (C and D) quantitative analysis of (A and B). (E and F) Uptake of Ber and Pal by microglia at 2, 4, 6, 12 and 24 h. The concentration of Ber/Pal was 0.3 μM. (G and H) Fluorescence imaging of cortex and hippocampus. PKH26-labelled Exos were intravenously injected for 6 h and 24 h. (I and J) quantitative data of (G and H). (K and L) Ber and Pal concentrations in the hippocampus, cortex and striatum were detected by LC-MS after intravenous injection with Ber/Pal and Exos-Ber/Pal for 24 h. The PKH26 was 2 μM. The Ber/Pal dosage was 0.88/1.13 mg/kg. The scale bar for (A and B) and (G) is 50 μm. The scale bar for (H) is 100 μm. (A–J), n = 3; (K and L), n = 6. *p < 0.05, **p < 0.01.
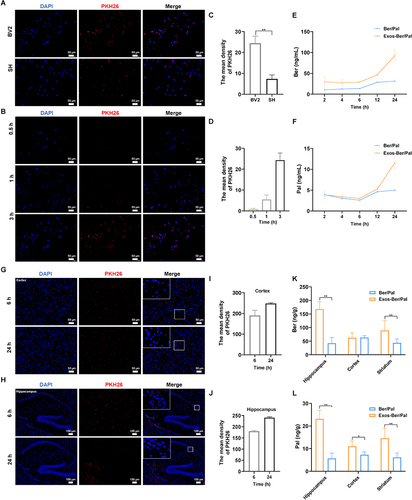
Figure 6 Effect of Exos-Ber/Pal on neuroinflammation in vitro and behaviour in APP/PS1 mice. (A) The NO concentration in LPS-stimulated (250 ng/mL) microglia was detected with the Griess method. (B–E) Inflammatory cytokine detection of TNF-α, IL-1β, IL-4 and IL-10. Inflammatory cytokines in microglia stimulated by Aβ25-35 (20 μM) after coincubation with Ber/Pal, Exos and Exos-Ber/Pal for 24 h. The microglia were stimulated with LPS/Aβ25-35 for 1 h in advance. The concentration of Ber/Pal was 0.3 μM. (F) Schematic illustration of the experiment. (G) The escape latency time, (H) platform crossing times, and (I) target quadrant occupancy in the MWM. (J) Representative motion trajectories in the MWM. i, the first quadrant of MWM; ii, the second quadrant of MWM; iii, the third quadrants of MWM; iv, the fourth quadrants of MWM. (K) OLT performance of mice administered different formulations. WT indicates wild-type control mice without any gene intervention. APP/PS1 indicates the AD model mice. The Ber/Pal injection dosage was 1.22/1.52 mg/kg. (A), n = 3; (B–E), n = 6; (F–K), n = 8. *p < 0.05, **p < 0.01.
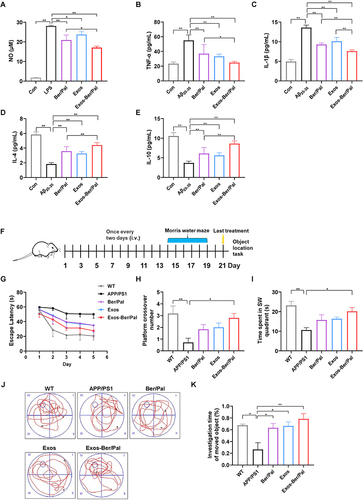
Figure 7 Effect of Exos-Ber/Pal on neuronal recovery in APP/PS1 mice. (A) Immunofluorescence staining of NeuN-positive cells and (B and C) NeuN-positive cell counting in the hippocampus and cortex. (D) Immunofluorescence observation and (E–G) semiquantitative data of PSD95 in the CA1, CA3 and cortex. WT indicates wild-type control mice without any gene intervention. APP/PS1 indicates the AD model mice. The Ber/Pal injection dosage was 1.22/1.52 mg/kg. The scale bar for (A) is 100 μm (hippocampus) and 20 μm (cortex). The scale bar for (D) is 20 μm. n = 3. *p < 0.05, **p < 0.01.
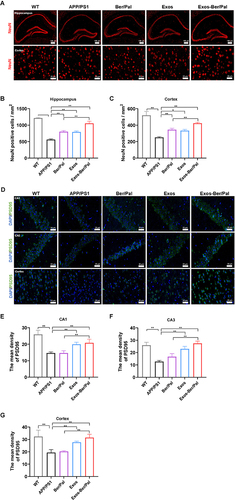
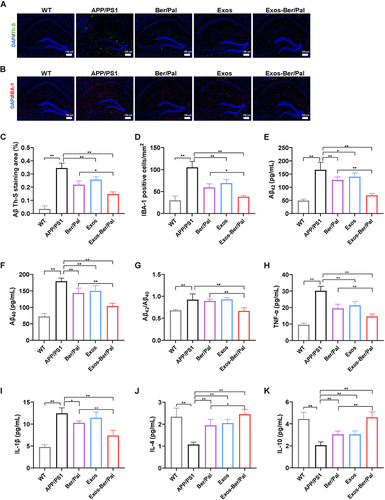
Figure 8 Effect of Exos-Ber/Pal on plaque inhibition, microglial activation and inflammation in APP/PS1 mice. Immunofluorescence staining observation of (A) Th-S (Aβ) and (B) IBA-1 in the hippocampus. Quantitative analysis of (C) Aβ and (D) IBA-1. (E–G) Concentration determination of Aβ42 and Aβ40 and the ratio of Aβ42/Aβ40 in the hippocampus by ELISA. (H–K) Inflammatory cytokine detection of TNF-α, IL-1β, IL-4 and IL-10 in the hippocampus. WT indicates wild-type control mice without any gene intervention. APP/PS1 indicates the AD model mice. The Ber/Pal injection dosage was 1.22/1.52 mg/kg. The scale bar is 100 μm. (A–D), n = 3. (E–K), n = 5. *p < 0.05, **p < 0.01.
Data Sharing Statement
Data will be made available on request. The original data in this study can be obtained from the corresponding author (Qichun Zhang).