Figures & data
Figure 1 Illustration to show the superimposed conformations obtained by docking ragaglitazar and the ten derivative compounds (Comp#1–#10) to PPARα and PPARγ receptors, respectively. (A) Ragaglitazar and Comp#1–#10 to PPARα (1k7l). (B) Ragaglitazar and Comp#1–#10 to PPARγ (1k74). (C) Ragaglitazar and Comp#1 to PPARα (1k7l). (D) Ragaglitazar and Comp#1 to PPARγ (1k74).
Abbreviations: PPARα, peroxisome proliferator-activated receptor-alpha; PPARγ, peroxisome proliferator-activated receptor-gamma.
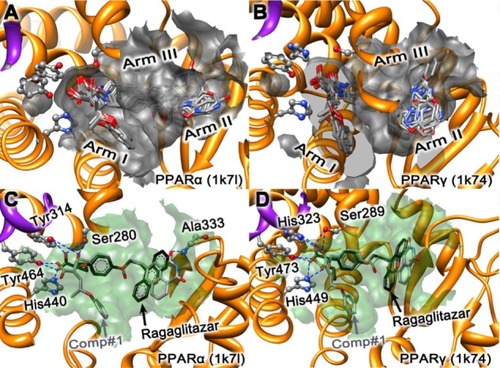
Figure 2 Illustration to show how to generate the best ten compounds from the ZINC36728034 structure through the core hopping method.
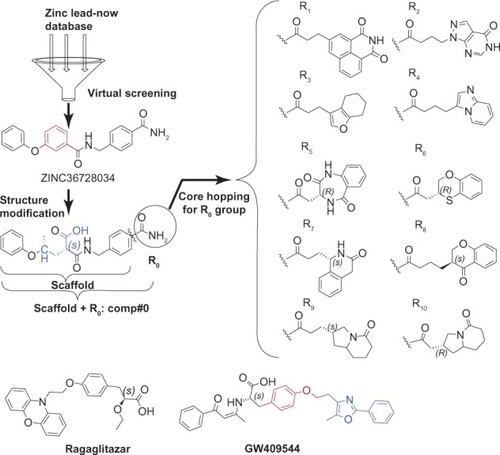
Table 1 The compound ragaglitazar was used as a positive control, and the ten compounds (Comp#1–#10) were ranked roughly according to their docking scores to the receptors PPARα and PPARγ
Figure 3 Illustration to show the outcomes of molecular dynamic simulations for the interactions of the receptors with Comp#1 – the best derivative found in this study, as shown in . (A) The RMSD of all backbone atoms for the receptor PPARα. (B) The RMSD of all backbone atoms for the receptor PPARγ. (C) The RMSF of the side-chain atoms for the receptor PPARα. (D) The RMSF of the side-chain atoms for the receptor PPARγ.
Abbreviations: RMSD, root mean square deviation; PPARα, peroxisome proliferator-activated receptor-alpha; PPARγ, peroxisome proliferator-activated receptor-gamma; RMSF, root mean square fluctuation.
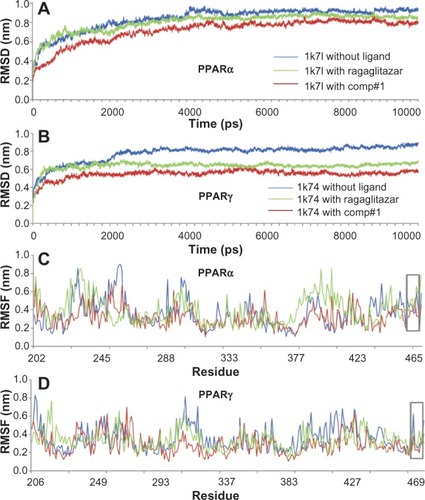
Table 2 The residues involved in forming the binding pocket of PPARα and PPARγ for the ligand Comp#1Table Footnotea