Figures & data
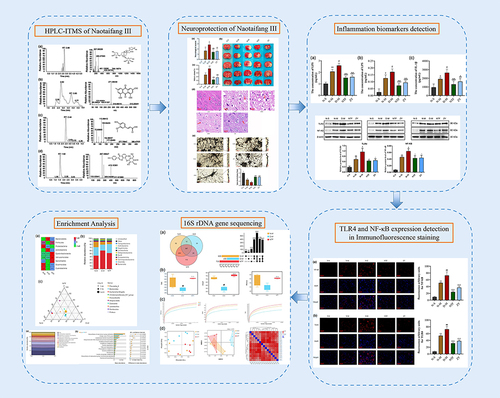
Table 1 Drug Composition of Naotaifang III
Figure 1 Establishment of the intestinal dysbacteriosis rat model.
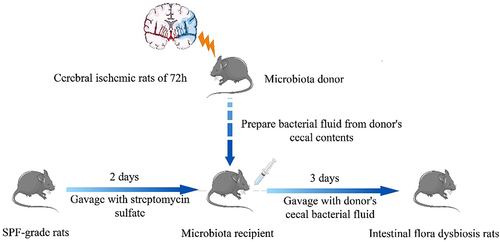
Figure 2 Treatment of each group.
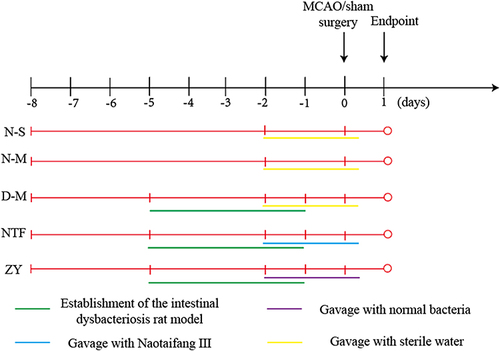
Figure 3 Quality control of Naotaifang III.
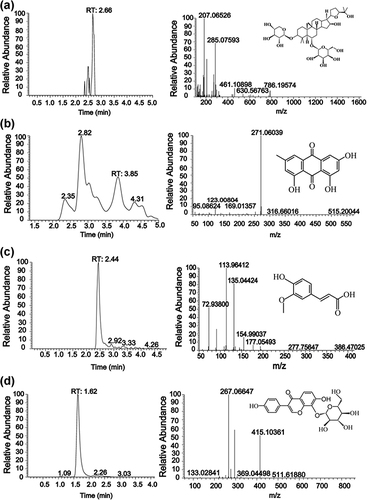
Figure 4 Effects of intestinal microbiota disorder on neurological function score and cerebral infarction volume at different time after cerebral ischemia.
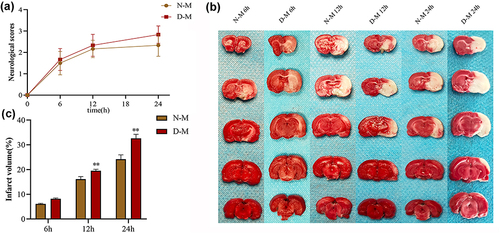
Figure 5 Effects of Naotaifang III on the cerebral injury.
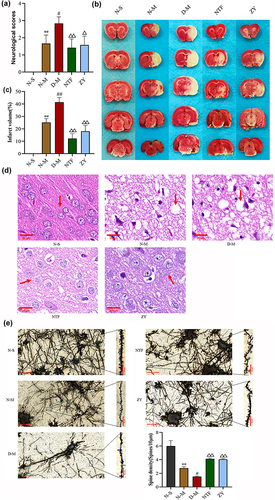
Figure 6 Effects of Naotaifang III on LPS in blood plasma and brain cortex, IL-1β in brain cortex.
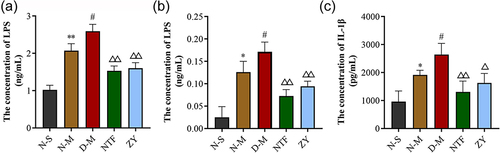
Figure 7 Effects of Naotaifang III on TLR4 and NF-κB expression in brain cortex (immunofluorescence staining, 400×).
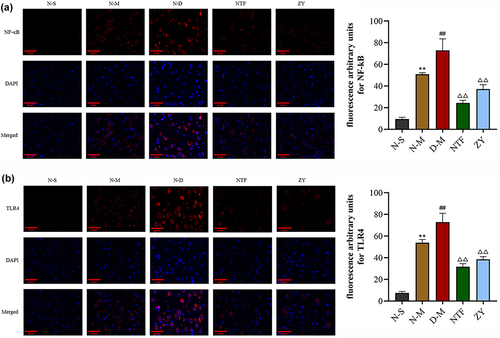
Figure 8 Effects of Naotaifang III on TLR4 and NF-κB expression in brain cortex (Western blot).
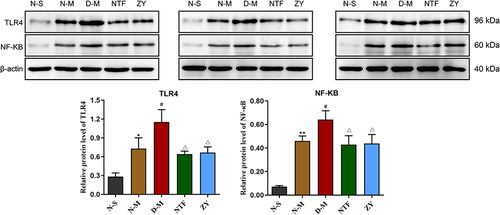
Figure 9 Effects of Naotaifang III on intestinal microbiota diversity.
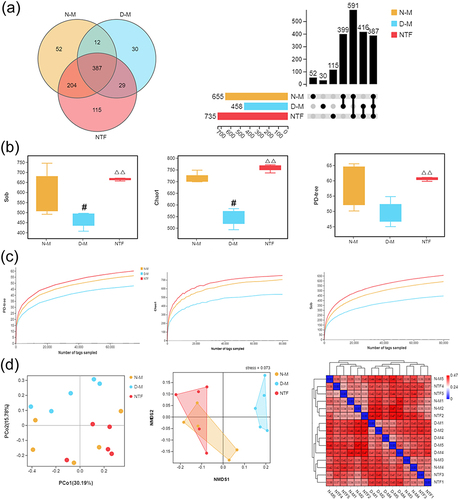
Figure 10 Effects of Naotaifang III on intestinal microbiota structure.
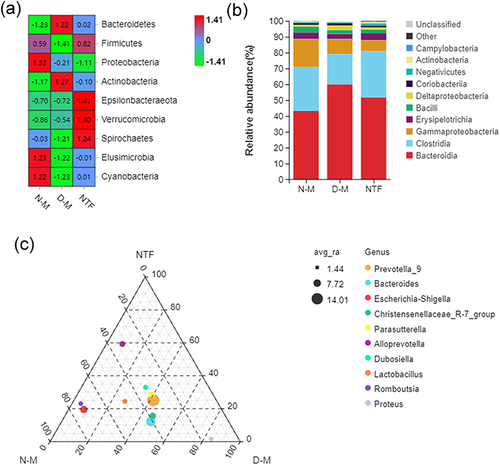
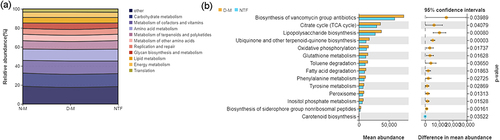
Figure 11 Effects of Naotaifang III on intestinal microbiota function.