Figures & data
Table 1 Sequences for the Primers Used in the qRT-PCR Experiments
Figure 1 17(R)-Resolvin D1 treatment ameliorates pressure overload-induced cardiac dysfunction in mice. Protocol (A). Mice were subjected to either transverse aortic constriction (TAC) or a sham operation. 2 μg/kg 17(R)-RvD1 (Cayman ChemicalAnn, Arbor, Michigan) or saline was injected intraperitoneally before TAC and once every other day for 4 weeks until harvest. The left ventricular end-diastolic diameter (LVEDd) (B) and left ventricular end-systolic diameter (LVESd) (C) were measured by echocardiography in each group (n=5). The left ventricle ejection fraction (LVEF) and fractional shortening (LVFS) were calculated using the LVEDd and LVESd values (D and E). Heart weight (HW)/body weight (BW) (F) and HW/tibia length (TL) (G) ratios in the indicated group (n=5). The data were analyzed using One-way ANOVA followed by Tukey’s post hoc test. A level of P<0.05 was considered to be statistically significant. Data are presented as the mean ± SEMs. *P < 0.05 compared with the Sham group, #P < 0.05 compared with the TAC group.
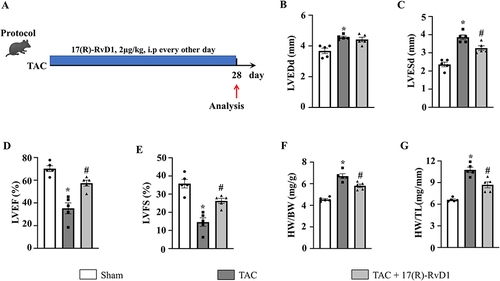
Figure 2 17(R)-Resolvin D1 treatment improves cardiac hypertrophy induced by pressure overload. Histological analyses of the hematoxylin-eosin (HE) staining (A and B), wheat germ agglutinin (WGA) staining (C) and quantification of the average cross-sectional areas (D) in each group (n=3) (Scale Bar, 50μm). Expression of transcripts of hypertrophic biomarkers ANP (E), BNP (F), β-MHC (G) in each group, as determined by RT-PCR analysis (n=4). The data were analyzed using One-way ANOVA followed by Tukey’s post hoc test. Data are presented as the mean ± SEMs. *P < 0.05 compared with the Sham group, #P < 0.05 compared with the TAC group.
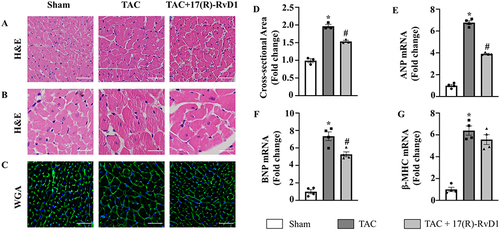
Figure 3 17(R)-Resolvin D1 treatment improves cardiac fibrosis in mice after TAC surgery. PSR staining of histological sections of left ventricles (A) and statistical results of LV collagen volume (B and C) (n=3) (Scale Bar, 50μm). The mRNA expressions of collagen I (D), collagen III (E), transforming growth factor (TGF)-β1 (F), and connective tissue growth factor (CTGF) (G), in the myocardium were obtained from the indicated groups using RT-PCR analysis (n=4). Protein expressions of P-Smad2/3 and T-Smad2/3 were tested by Western blot analysis. GAPDH was used as an internal control (H) and quantification of the p-Smad2/3 level in the indicated groups (n=3) (I). The data were analyzed using One-way ANOVA followed by Tukey’s post hoc test. Data are presented as the mean ± SEMs. *P < 0.05 compared with the Sham group, #P < 0.05 compared with the TAC group.
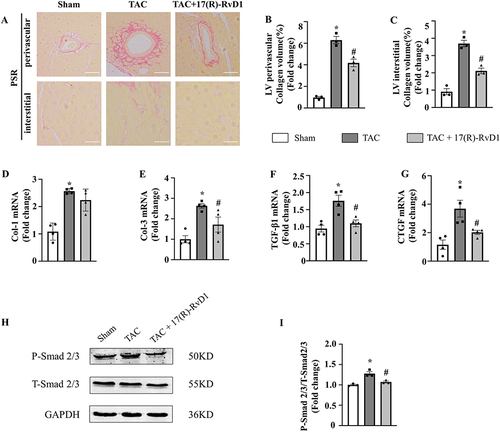
Figure 4 17(R)-Resolvin D1 reduces inflammatory cytokine production and the infiltration of inflammatory cells induced by pressure overload in cardiac tissue. Infiltration of CD68+ macrophages (A and B) in the heart in different groups (n=3) (Scale Bar, 40μm), the black arrowheads indicate CD68-positive cells. The mRNA levels of pro-inflammatory cytokines tumor necrosis factor-α (TNF-α) (C), interleukin (IL)-1β (D), and IL-6 (E) were assessed in cardiac tissue (n=4). The data were analyzed using One-way ANOVA followed by Tukey’s post hoc test. Data are presented as the mean ± SEMs. *P < 0.05 compared with the Sham group, #P < 0.05 compared with the TAC group.
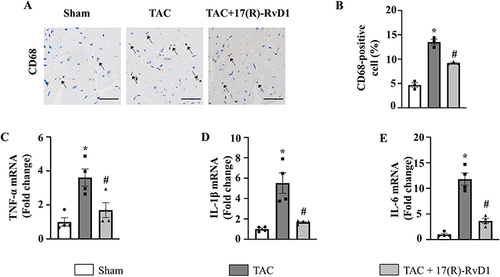
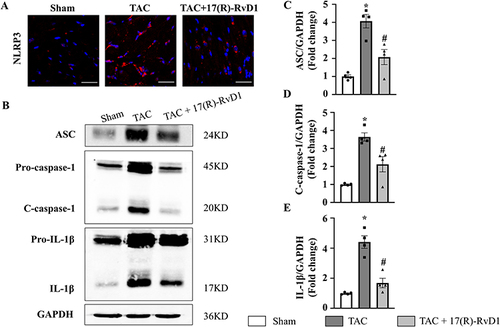
Figure 5 17(R)-Resolvin D1 treatment suppressed the activation of the NLRP3 signalling pathway in the heart. NLRP3 was assessed by immunofluorescence in the LV tissue of each group (n=3) (Scale Bar, 40μm) (A). Protein expressions of apoptosis-associated speck-like protein containing a CARD (ASC), c-caspase-1, procaspase-1, IL-1β, and pro-IL-1β in myocardial tissue were tested by Western blot analysis (B), GAPDH was used as internal control and quantification of the ASC, c-caspase-1, IL-1β level in the indicated groups were analyzed (C–E) (n=4). The data were analyzed using One-way ANOVA followed by Tukey’s post hoc test. Data are presented as the mean ± SEMs. *P < 0.05 compared with the Sham group, #P < 0.05 compared with the TAC group.