Figures & data
Figure 1 Flow chart of scientometric analysis.
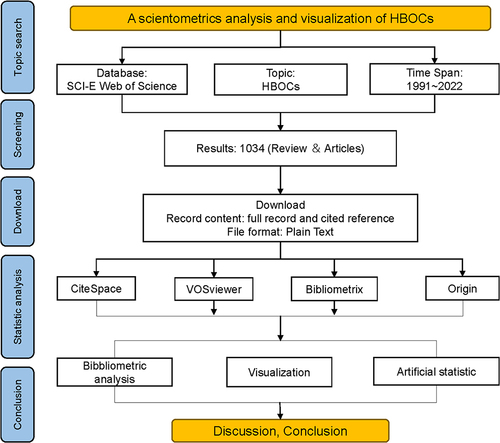
Figure 2 Annual publications between 1991–2022.
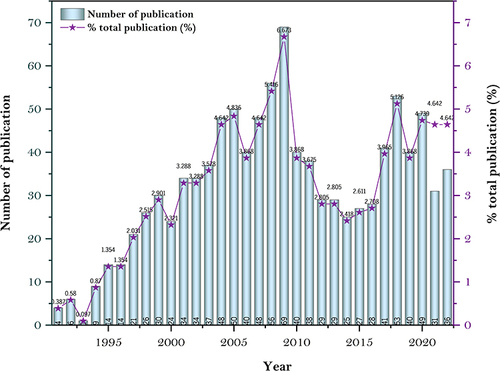
Figure 3 Distribution of major research directions.
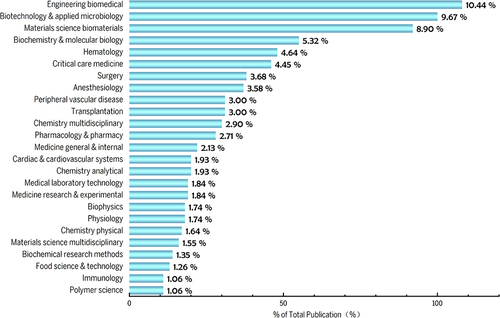
Table 1 The Top 10 Productive Countries/Regions Related to HBOCs Research
Figure 4 (A) Geographical distribution map based on the total publications of different countries/regions. (B) The changing trend of the annual publication quantity in the top ten countries/regions from 1991 to 2022. (C) The international collaborations’ visualization map of countries/regions.
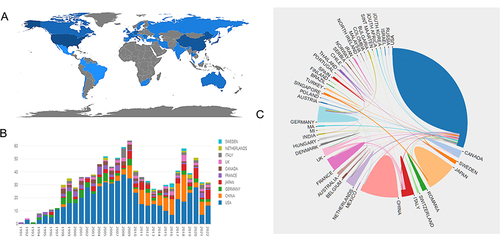
Table 2 The Top 10 Productive Institutions Related to HBOCs Research
Table 3 The Top 10 Authors with Most Publications Related to HBOCs Research
Table 4 The Top 20 Journals with Most Publications Related to HBOCs Research
Table 5 Top 20 Co-Cited Journals Related to HBOCs Research
Table 6 The Top 10 Cited References Related to HBOCs
Figure 5 Reference timeline view.
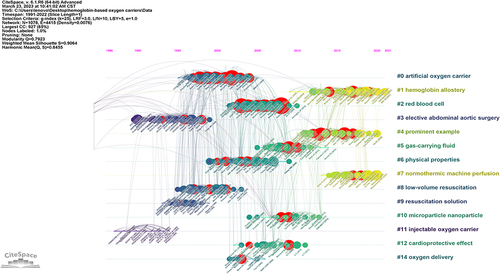
Figure 6 (A) VOSviewer network map of co-occurrence analysis of all keywords of HBOCs-related studies. (B) Top 25 keywords with the strongest citation bursts on HBOCs from burst analysis of keywords.
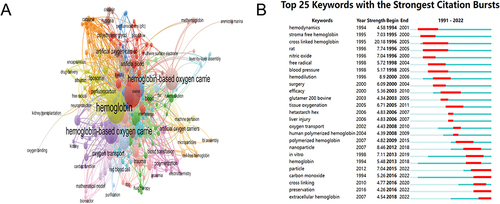
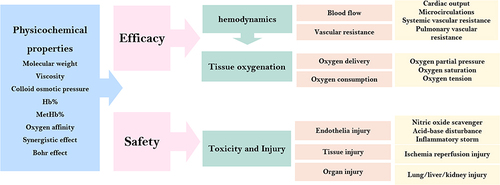
Figure 7 (A) Type of HBOCs. (B) Physiological mechanism. (C) Clinical scenario. (D) Adverse event.
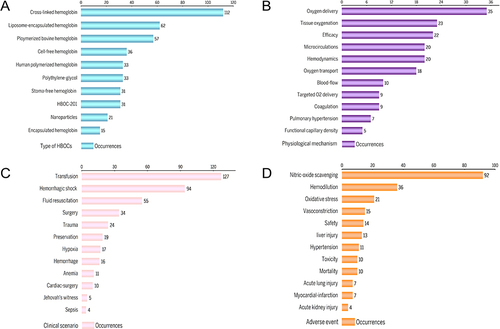
Figure 8 Hemoglobin modifications mechanisms.
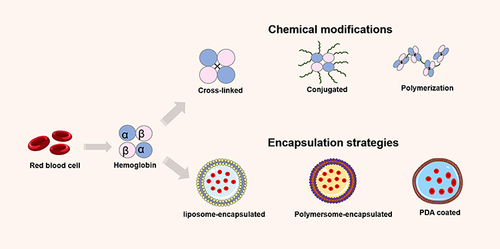
Table 7 Physiochemical Parameters and their Active Mechanisms on HBOCs
Figure 9 The brief evaluation system for HBOCs in vivo and in vitro trials.