
Figures & data
Figure 1 Subjects flow chart. Flow chart of the subjects in the fasted state (A). Flow chart of the subjects in the fed state (B). N: the number of subjects.
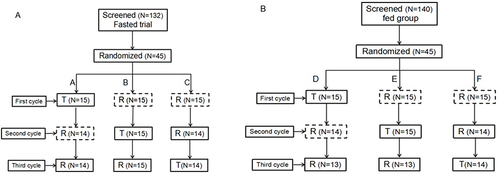
Table 1 The Ingredient List of High-Fat Meal
Table 2 Demographic Information and Baseline Information of Subjects in Groups
Figure 2 Arithmetic mean (SE) plasma concentration versus time profiles of valsartan (A), amlodipine (B) after single oral dose administration of valsartan/amlodipine tablet (80/5mg) under fed and fasted conditions.
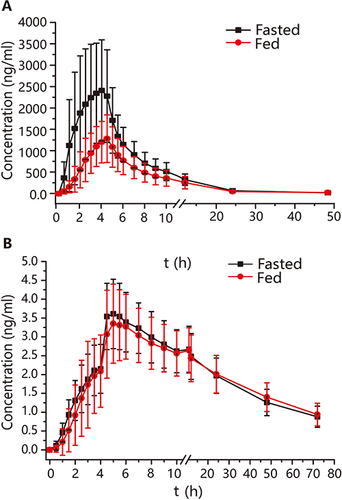
Table 3 Mean Pharmacokinetic Parameter Values for Valsartan and Amlodipine