Figures & data
Table 1 Primer sequences and annealing temperature of the genes in RT-PCR
Figure 1 Growth inhibiting effects of RPM on pancreatic cancer cell lines PC-2 and PANC-1.
Abbreviations: ANOVA, analysis of variance; MTT, 3-(4,5-Dimethylthiazol-2-yl)-2,5-diphenyltetrazolium bromide; RPM, rapamycin.
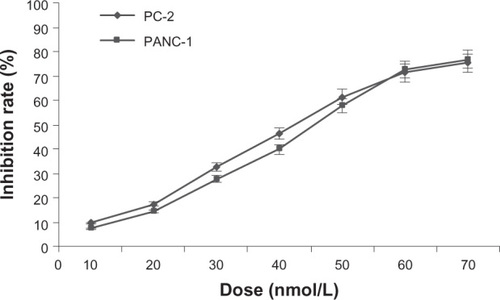
Figure 2 Effect of radiation plus RPM on cell viability of pancreatic cancer cells with MTT assay, in (A) PC-2 cells and (B) PANC-1 cells.
Abbreviation: ANOVA, analysis of variance; MTT, 3-(4,5-Dimethylthiazol-2-yl)-2,5-diphenyltetrazolium bromide; RPM, rapamycin.
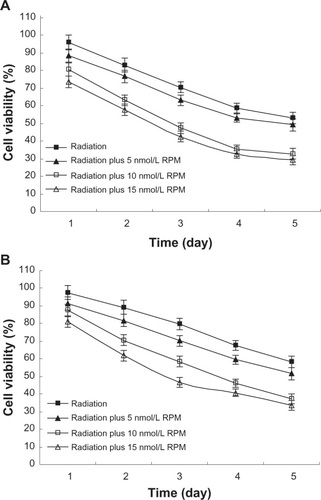
Figure 3 Survival fraction of pancreatic cancer cells treated by different dose of irradiation (A) PC-2 cells; (B) PANC-1 cells.
Abbreviation: RPM, rapamycin.
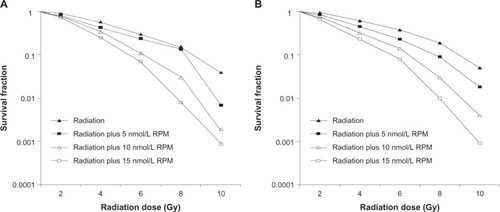
Figure 4 MDC-labeled autophagic vacuoles in PC-2 cells by fluorescence microscope after RPM treatment. Autophagic vacuoles were labeled with 0.05 mmol/L MDC in PBS, at 37°C for 10 minutes. (A) 0 nmol/L RPM group; (B) 10 nmol/L RPM group; and (C) 15 nmol/L RPM group (×200).
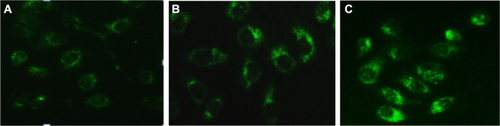
Figure 5 Effects of radiation plus RPM on the cell cycle of PC-2 cells, under FCM.
P < 0.05, ##
P < 0.01 versus the radiation alone group.
Abbreviations: FCM, flow cytometry; PI, propidium iodide; RPM, rapamycin.
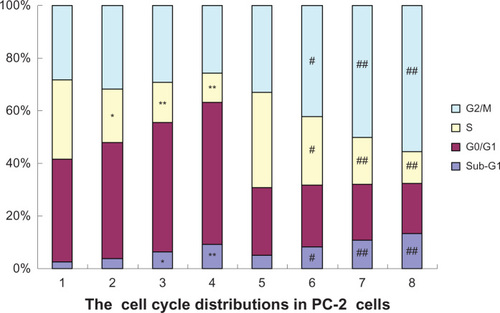
Table 2 The DNA damage repair and transcription genes differentially expressed in PC-2 cells induced by RPM
Figure 6 Scatter plot of the gene differential expression in PC-2 cells induced by RPM.
Abbreviation: RPM, rapamycin.
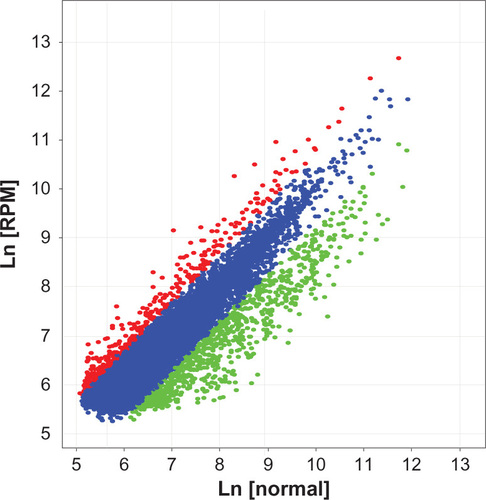
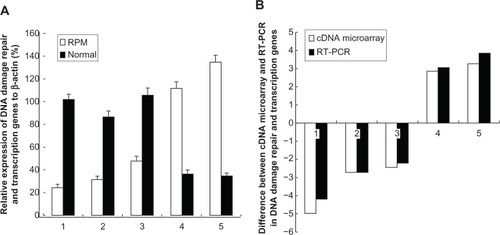
Figure 7 (A) RT-PCR analysis for the DNA-damage repair and transcription genes after the treatment with RPM; (B) Difference between the cDNA microarray and RT-PCR in DNA-damage repair and transcription genes.
Abbreviations: RPM, rapamycin; RT-PCR, reverse transcription polymerase chain reaction; SD, standard deviation.