Figures & data
Figure 1 Consolidated Standards of Reporting Trials diagram. A patient flow diagram is shown. Group C, Control group; Group D, Dexmedetomidine group.
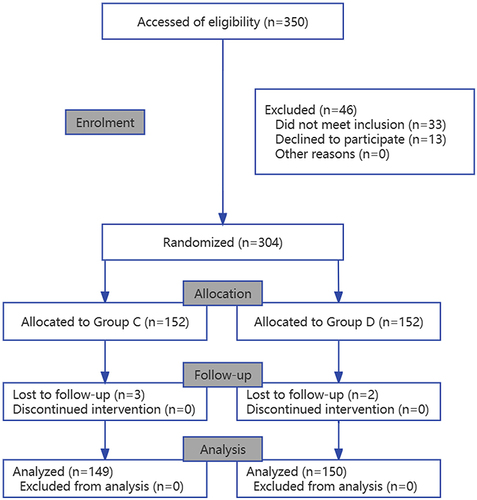
Table 1 Patient Characteristics Between the Two Groups
Table 2 Incidence of POD Between Two Groups
Table 3 Patient Characteristics Between the Two Groups of Blood Sampling
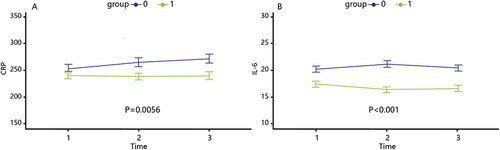
Figure 2 The change in serum inflammation factors CRP (A) and IL-6 (B) at three timepoints. Group 0=Control group, Group 1=Dexmedetomidine group; Time 1=baseline, Time 2=postoperative day 1, Time 3=postoperative day 3.