Figures & data
Figure 1 Chemical structures of imatinib (A) and tamsulosin (B) used as internal standard.
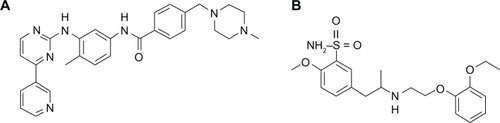
Table 1 Chromatographic linear gradient scheme. Both methanol and water contain 10 mM of ammonium acetate and 0.1% of formic acid
Figure 2 Chromatograms of (A) sample at lower limit of quantification level plus internal standard prepared in solvent. Extracted blank serum samples, (B) normal, (C) hemolyzed, and (D) hyperlipemic. Responses (vertical axes) are normalized to highest peak.
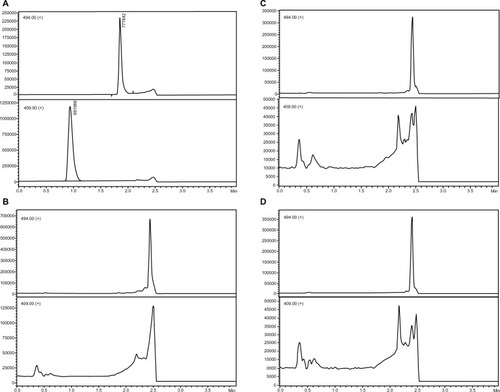
Figure 3 Chromatograms of sample at lower limit of quantification level plus internal standard extracted as per the protocol.
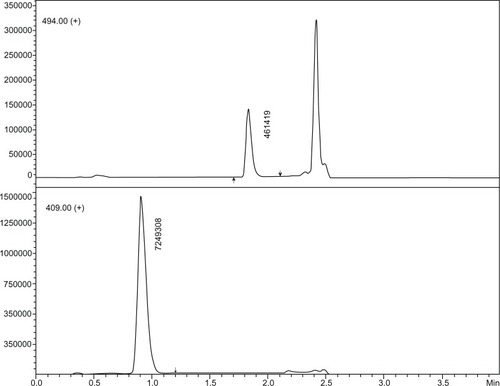
Table 2 Recovery and matrix effect results for analyte and internal standard
Figure 4 Calibration curves of first, second, and third batches of linearity test from top to bottom, with respective equations and coefficients of correlation (R^2).
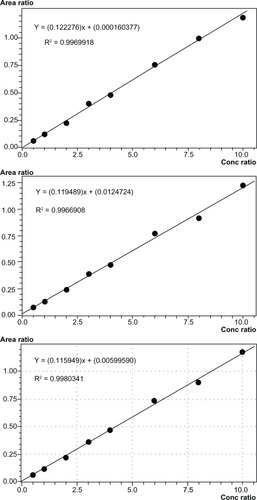
Table 3 Results of precision and accuracy experiments, intrabatch and interbatch
Table 4 Limits of stability approved for imatinib
Table 5 Stability test results for imatinib
Table 6 Method enhancements and performance compared with a previous validated method