Figures & data
Figure 1 X-ray diffraction patterns for iron oxide (A) and iron oxide coated with chitosan and 6-mercaptopurine (FCMP) (B). Inset shows X-ray diffraction pattern for pure chitosan (C) and pure 6-mercaptopurine (D).
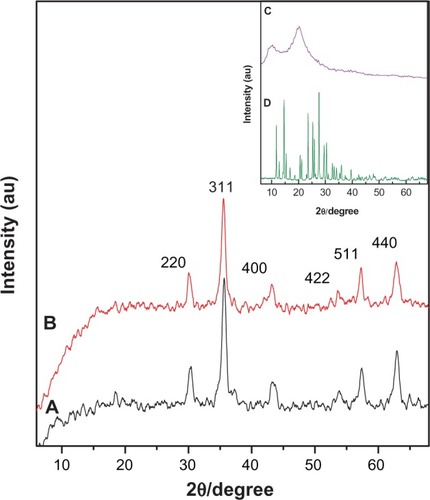
Figure 2 Fourier transform infrared spectra for (A) iron oxide nanoparticles, (B) chitosan, (C) iron oxide nanoparticles coated with chitosan, (D) pure 6-mercaptopurine, and (E) FCMP, iron oxide nanoparticles coated with chitosan and 6-mercaptopurine.
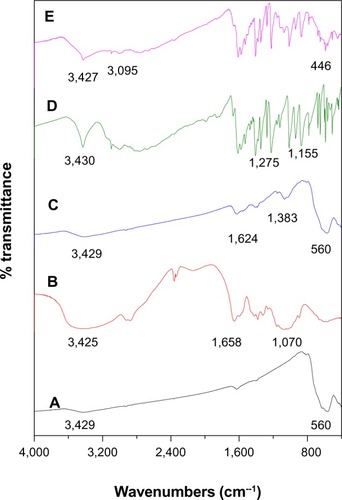
Table 1 Magnetic properties of Fe3O4 magnetite nanoparticles and FCMP
Figure 3 Magnetization plots of (A) iron oxide magnetite nanoparticles and (B) iron oxide nanoparticles coated with chitosan and 6-mercaptopurine.
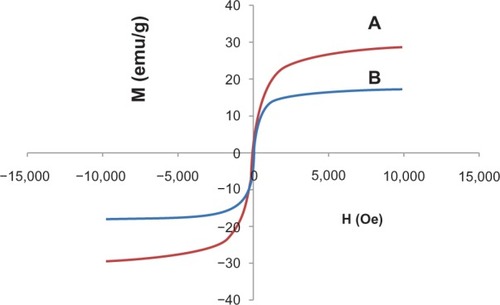
Figure 4 Thermogravimetry analyses of (A) 6-mercaptopurine and (B) iron oxide nanoparticles coated with chitosan and 6-mercaptopurine.
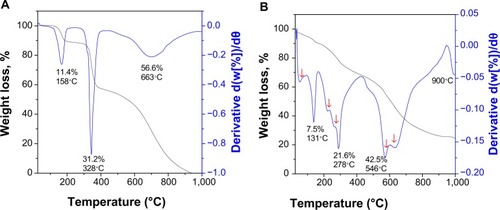
Figure 5 Transmission electron micrographs for (A) iron oxide magnetite nanoparticles (200 nm bar), (B) iron oxide nanoparticles coated with chitosan and 6-mercaptopurine (200 nm bar), particle size distribution of iron oxide nanoparticles (C) and particle size distribution of iron oxide nanoparticles coated with chitosan and 6-mercaptopurine (D).
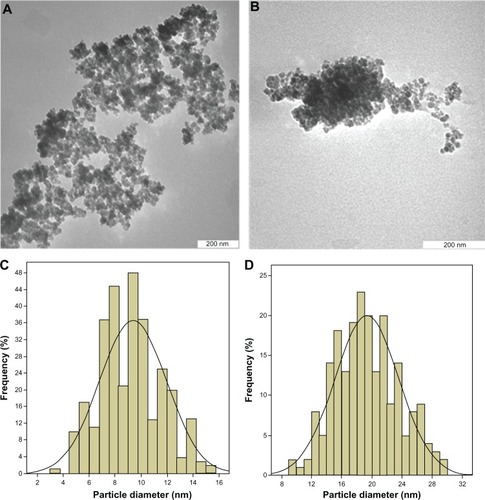
Figure 6 (A) Release profiles for physical mixtures of 6-mercaptopurine and (B) 6-mercaptopurine from iron oxide nanoparticles coated with chitosan and 6-mercaptopurine dissolved in hot ethanol into (I) phosphate-buffered solution at pH 4.8, (II) phosphate-buffered solution at pH 7.4, and (C) release profiles for 6-mercaptopurine from the iron oxide nanoparticles containing the same amounts of chitosan and 6-mercaptopurine dissolved in dimethyl sulfoxide into (III) phosphate-buffered solution at pH 4.8 and (IV) phosphate-buffered solution at pH 7.4.
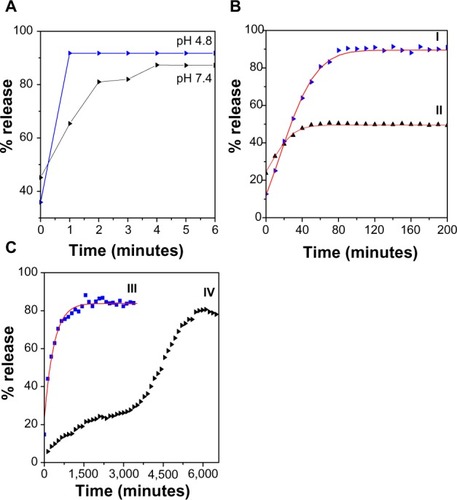
Table 2 Correlation coefficient, rate constant, and elimination half-life obtained by fitting the data for release of MP and MP-D from FCMP and FCMP-D into phosphate-buffered solution at pH 4.8 and pH 7.4
Figure 7 Fitting the data for 6-mercaptopurine release from iron oxide nanoparticles coated with chitosan and 6-mercaptopurine dissolved in hot ethanol into different solutions to the pseudo-second order kinetics for pH 4.8 (A) and pH 7.4 (B) and fitting data of 6-mercaptopurine released from the iron oxide nanoparticles coated with chitosan and 6-mercaptopurine dissolved in dimethyl sulfoxide into different solutions to the pseudo-second order kinetics for pH 4.8 (C) and first order kinetics for pH 7.4 (D).
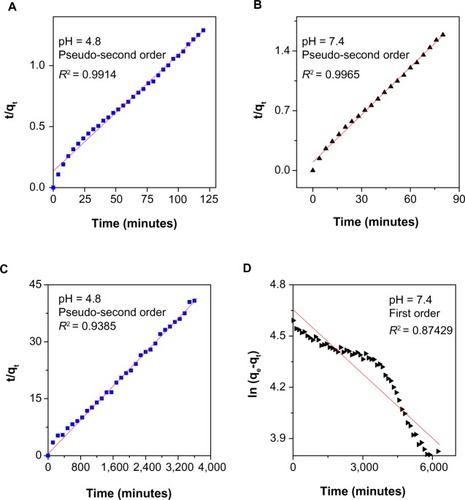
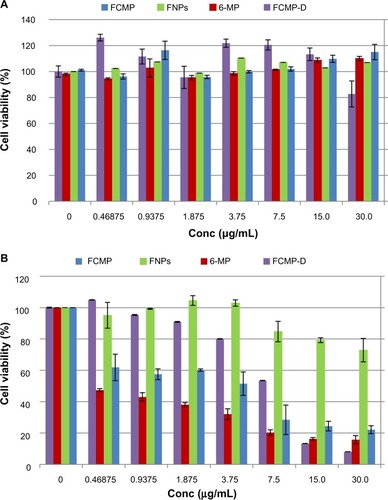
Figure 8 Viability assays for (A) normal mouse fibroblast (3T3) and (B) leukemia (WEHI-3) cell lines and anticancer activity of FCMP, FCMP-D, FNPs, and pure 6-MP, respectively, after 72 hours of treatment. The IC50 was 4.94 ± 0.76 μg/mL, 11.94 ± 0.45 μg/mL, 47.56 ± 2.13 μg/mL, and 0.60 ± 0.18 μg/mL for cancer cells exposed to FCMP, FCMP-D, FNPs, and pure 6-MP, respectively.