Figures & data
Table 1 Baseline characteristics of the study population
Table 2 Antidiabetic therapy in vildagliptin and control patients
Figure 1 Glycated hemoglobin (HbA1c) levels in vildagliptin and control groups from baseline to follow-up at 8 months in stable heart transplant recipients with type 2 diabetes mellitus.
Abbreviations: BL, baseline; CG, control group; mo, months; VG, vildagliptin group.
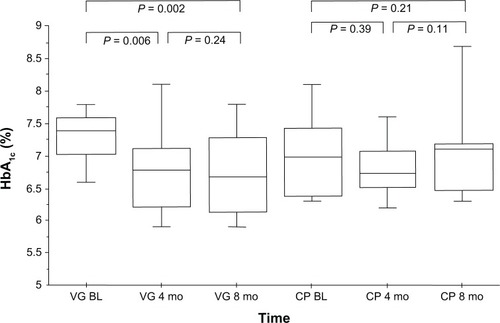
Figure 2 Mean blood glucose (MBG) levels of vildagliptin and control groups from baseline to follow-up at 8 months in stable heart transplant recipients with type 2 diabetes mellitus.
Abbreviations: BL, baseline; CG, control group; mo, months; VG, vildagliptin group.
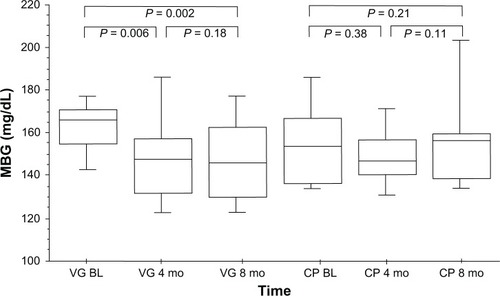
Table 3 Immunosuppression regimen in vildagliptin and control patients