
Figures & data
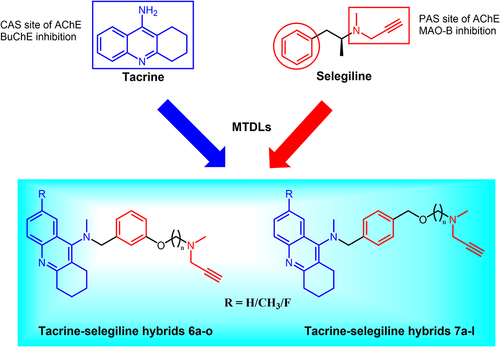
Figure 1 Design strategy toward tacrine-selegiline hybrids 6a-o and 7a-l.
Scheme 1 Synthesis of tacrine-selegiline hybrids 6a-6o and 7a-7l. Reagents and conditions: (i) KI, 1-pentanol, reflux at 130 °C for 10 h; (ii) HCHO, AcOH, DMF, r.t. for 60 min, followed by NaBH3CN, 8 h; (iii) Br(CH2)nBr, NaH, DMF, 0 °C to r.t., 12 h; (iv) N-methylpropargylamine, anhydrous K2CO3, MeCN, reflux at 70 °C for 12 h.
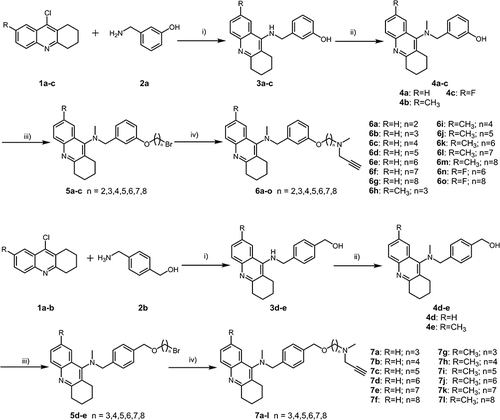
Table 1 Inhibition of AChE and BuChE by Tacrine-Selegiline Hybrids 6a-o and 7a-l
Table 2 Inhibition of hMAO-A and hMAO-B by Tacrine-Selegiline Hybrids 6a-o and 7a-l
Figure 2 Molecule docking results: (A and C) were 3D and 2D docking models of compound 7d with hAChE; (B and D) were 3D and 2D docking models of compound 7d with hBuChE. Atom colors: yellow-carbon atoms of 7d, grey-carbon atoms of residues of hAChE or hBuChE, dark blue-nitrogen atoms, and red-oxygen atoms. The figure was prepared using the ligand interactions application in MOE.
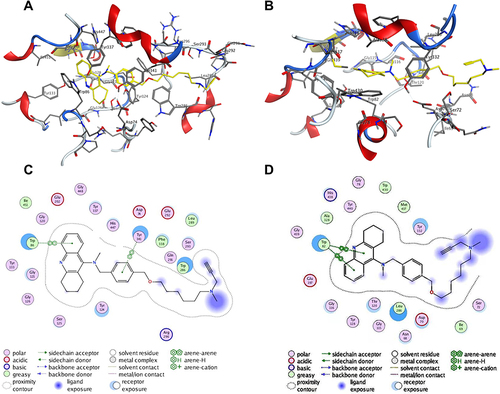
Figure 3 Molecule docking results: (A) 3D docking model of compound 7d with hMAO-B. Atom colors: yellow-carbon atoms of 7d, grey-carbon atoms of residues of hMAO-B, green-carbon atoms of FAD, dark blue-nitrogen atoms, and red-oxygen atoms; (B) 2D schematic diagram of docking model of compound 7d with hMAO-B. The figure was prepared using the ligand interactions application in MOE.
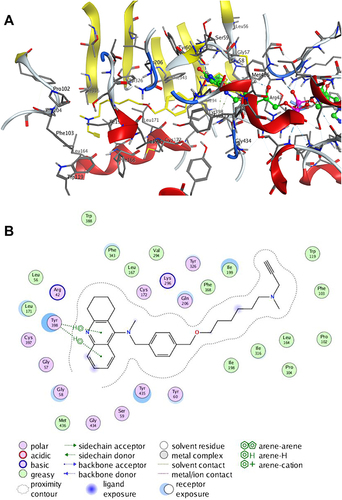
Table 3 Permeability Pe (× 10−6 Cm/s) in the PAMPA-BBB Assay for 10 Commercial Drugs in the Experiment Validation
Table 4 Permeability Pe (× 10−6 Cm/s) in the PAMPA-BBB Assay for the Target Compounds and Their Predicted Penetration into CNS
Figure 4 Lineal correlation between experimental and reported permeability of commercial drugs using the PAMPA-BBB assay. Pe (exp.) = 1.0654 Pe (bibl.) + 0.1625 (R2 = 0.9967).
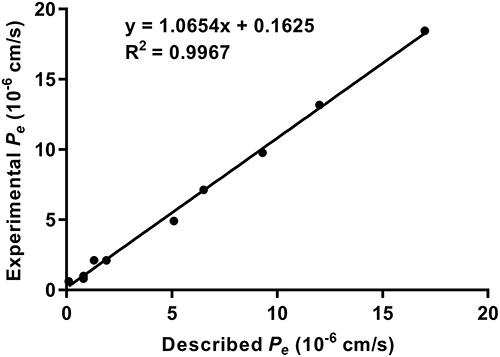
Figure 5 Cytotoxicity of compound 7d and donepezil on (A) PC12 and (B) BV-2 cells. PC12 and BV-2 cells were incubated with different concentrations of compound 7d or donepezil (0.3125–10 μM) for 24 h. The results were shown as cell viability after treated with compound 7d or donepezil vs untreated control cells. Data are shown as mean ± SD of three independent experiments.
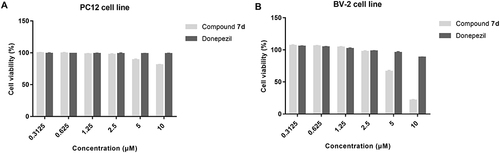
Figure 6 The change on body weight of mice after oral administration of different concentrations of compound 7d. Data are presented as the average weight ± SD of mice (n = 10).
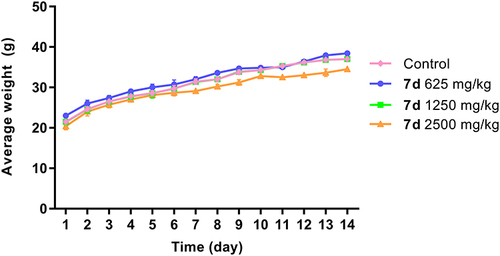
Figure 7 Histological analysis of heart, liver, kidney, lung and brain for the acute toxicity studies of compound 7d at a dosage of 2500 mg/kg in mice. Representative images of HE-stained are shown. Bar = 200 mm.
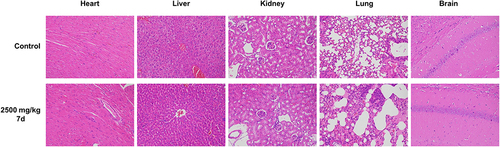
Figure 8 The effects of compound 7d on scopolamine-induced learning and memory impairment in the step-down test. (A) Latency. Data were analyzed by one-way analysis of variance (ANOVA) followed by Tukey’s Multiple Comparison Test, and the results are expressed as mean ± SEM (n = 8 per group). (B) Number of errors. Data were analyzed by the Kruskal–Wallis test followed by Dunn’s Multiple Comparison Test, and the results are expressed as boxplots illustrating medians within boxes from the first quartile (25th percentile) to the third quartile (75th percentile) and whiskers ranging from minimum to maximum (n = 8 per group). A p < 0.05 was considered the threshold for statistical significance with 95% CI. ####p < 0.0001 vs control group, *p < 0.05, **p < 0.01, ***p < 0.001 vs model group.
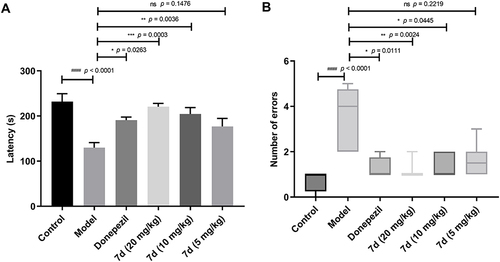
Table 5 Pharmacokinetic Parameters of Compound 7d After I.v. and I.p. Administration