Figures & data
Table 1 Disease Activity Index
Table 2 Pathological Scores
Table 3 Primer Sequences
Figure 1 The framework of this study.
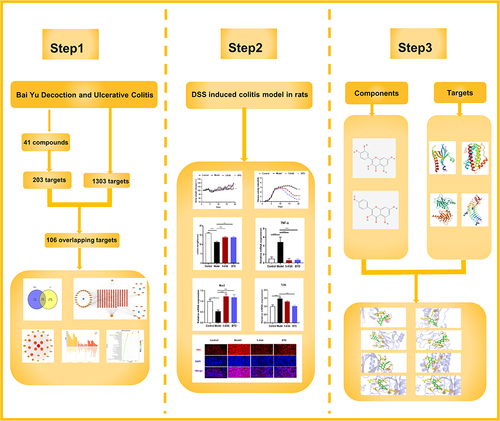
Figure 2 Analysis of the components of BYD by LC-MS/MS. The total ion chromatograms (TIC) of BYD. (A) The positive mode and (B) the negative mode.
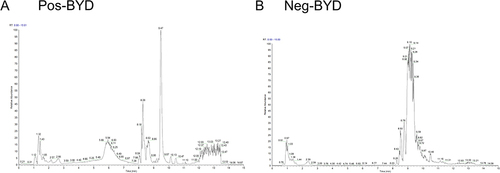
Table 4 Chemical Characterization of Bioactive Compounds in BYD
Figure 3 Active Ingredients of BYD and “Herb-Compound-Target” Network. (A) The number of ingredients in each herb. (B) Distribution Of BYD potential targets and UC targets. (C) Herb-Compound-Target network of BYD. Red rhombuses indicate targets. Blue squares represent three herbs: Baiyu, Diyu and Qingdai. Orange octagons show the major components of three herbs, respectively. The color and size of the nodes reflect the degree value. Grey lines indicate the interrelationships between compounds and targets.
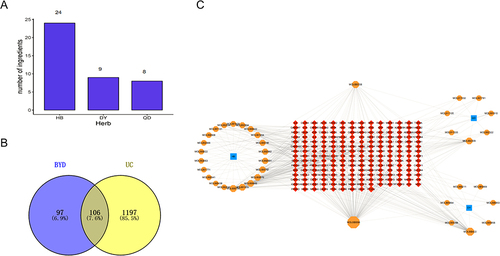
Table 5 Top 3 Compounds Information of BYD Network
Figure 4 PPI Network Analysis. (A) The interactive PPI network obtained from STRING database with the minimum required interaction score set to 0.97. Each node represents relevant targets, and edges stand for protein-protein associations. (B) PPI network imported from STRING database to Cytoscape 3.9.1. (C) PPI network of more significant proteins extracted from (B) by filtering 4 parameters: DC, EC, BC and CC.
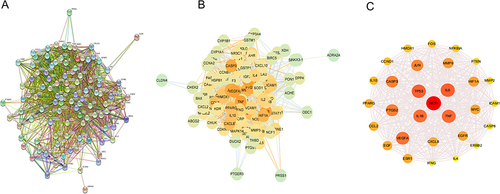
Table 6 Top 5 Targets Information of PPI Network
Figure 5 GO and KEGG Pathway Enrichment Analysis. (A) GO enrichment analysis for 106 key targets. (B) KEGG enrichment analysis for 106 key targets. (C) Component-Target-Pathway network. Red octagons indicate three herbs. Orange octagons show ingredients. Yellow circles suggest targets. Green V represent pathways. The color and size of the nodes reflect the degree value. Grey lines indicate the interrelationships between compounds and targets.
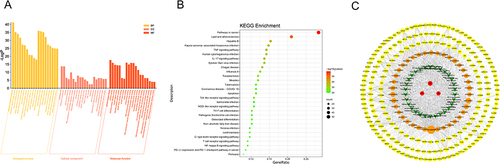
Figure 6 BYD ameliorates UC symptoms of colitis rat. (A) Time flow chart. (B) Representative images of perianal in control and model group. (C) Body weight changes during experiment (n = 6–8). (D) Disease active index (DAI) (n = 6–8). (E) Representative images of colon (n = 6–8). (F) length of colon (n = 6–8). (G) Representative H&E-stained colon section (scar bar, 100 µm) (n = 6–8). Data are expressed as Mean ± SEM. * P < 0.05, ** P < 0.01, *** P < 0.001; one-way ANOVA with Tukey’s post hoc analysis.
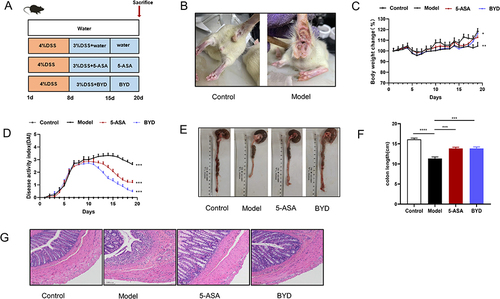
Figure 7 BYD inhibits the intestinal inflammation of colitis rat. (A) The histological score (n = 6–8). (B–H) Relative mRNA expression of TNF-α, IL-1β, IL-6, IL-17, IL-23, IL-12 and IL-10 in the colon tissue of rats (n = 6–8). (I–L) Relative protein expression of TNF-α, IL-1β, IL-6 and IL-10 in the serum of rats (n = 6–10). Data are expressed as Mean ± SEM. * P < 0.05, ** P < 0.01, *** P < 0.001; one-way ANOVA with Tukey’s post hoc analysis.
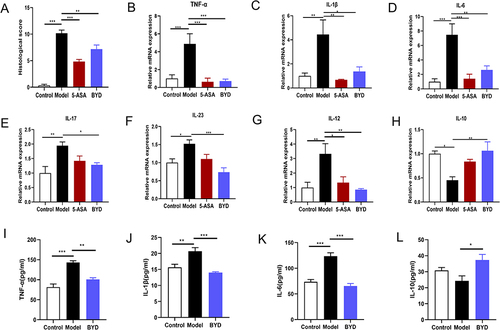
Figure 8 BYD protects the intestinal barrier of colitis rat. (A) Representative AB/PAS-stained colonic tissue section (scar bar, 100 µm). (B–D) Relative mRNA expression of ZO-1, Muc2, Occludin in the colon tissue of rats (n = 6–8). (E) Immunoblots of ZO-1 and Muc2 in the colon tissue of Rats. Data are expressed as Mean ± SEM. * P < 0.05, ** P < 0.01, *** P < 0.001, **** P < 0.0001; one-way ANOVA with Tukey’s post hoc analysis.
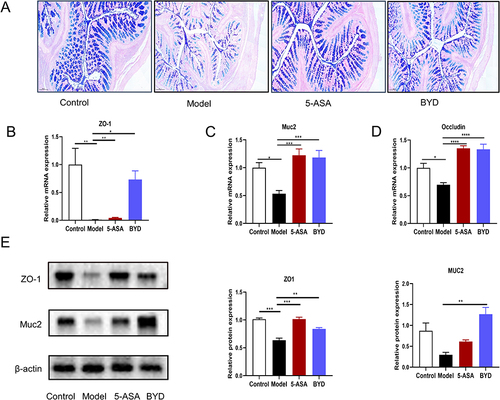
Figure 9 BYD suppresses TLR4/MyD88/NF-κB signaling pathway in colitis rat. (A) Immunofluorescence of TLR4, MyD88. (B) Relative mRNA expression of TLR4 and MyD88 in the colon tissue of rats (n = 6–8). (C) Immunofluorescence of p65. (D) Immunoblots of p65 and p-p65 in the colon tissue of rats. Data are expressed as Mean ± SEM. ** P < 0.01, *** P < 0.001; one-way ANOVA with Tukey’s post hoc analysis.
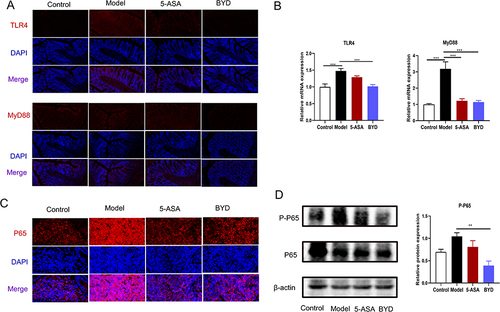
Figure 10 Molecular Docking Analysis. (A) AKT1 with quercetin; (B) IL-6 with quercetin; (C) TP53 with quercetin. (D) TLR4 with quercetin. (E) AKT1 with kaempferol. (F) IL-6 with kaempferol. (G) TP53 with kaempferol. (H) TLR4 with kaempferol. The hydrogen bonds were indicated by dashed lines and the length was added around the lines.
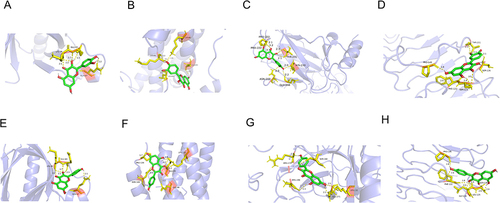
Table 7 The Binding Energy of Compound and Core Targets (Kcal/Mol)
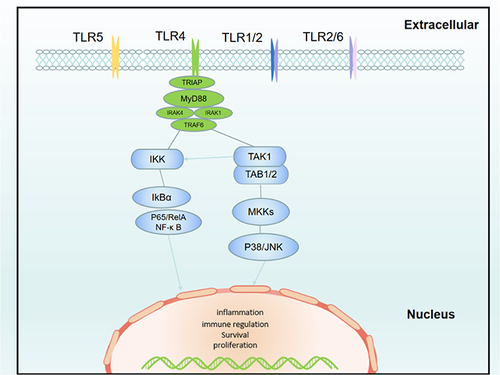
Figure 11 TOLL-like receptor signaling pathway.