
Figures & data
Table 1 Summary of Patient Characteristics
Table 2 Summary of the Model Development Process
Table 3 Population Pharmacokinetic Parameter Estimate from Final Model and Bootstrap Validation
Figure 1 Simulated individual vancomycin clearance versus creatinine clearance.
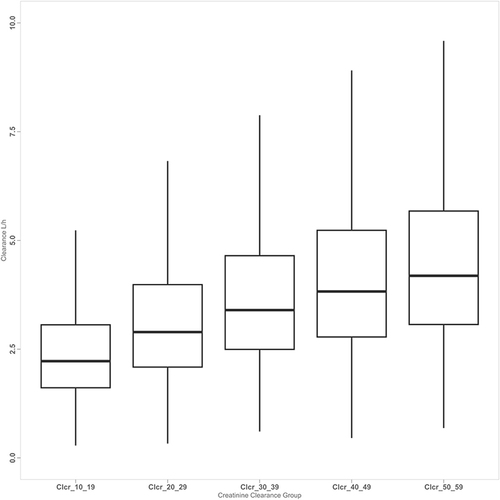
Figure 2 Individual and conditional weighted residuals versus time after the last dose (TAD) for the final model.
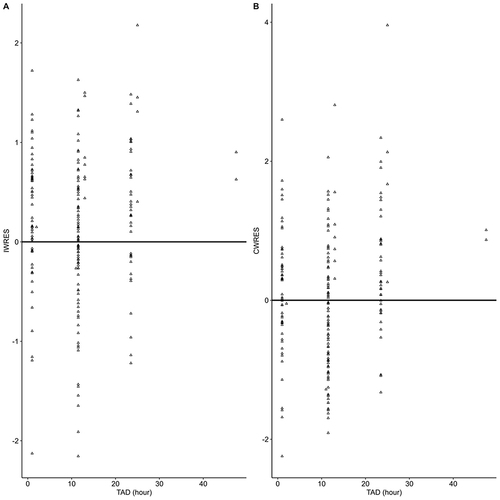
Figure 3 Normalized prediction distribution error (NPDE) plots of the observed concentrations and the final model (mean, −0.04612 [P >0.05]; variance, 0.8686326 [P > 0.05]).
![Figure 3 Normalized prediction distribution error (NPDE) plots of the observed concentrations and the final model (mean, −0.04612 [P >0.05]; variance, 0.8686326 [P > 0.05]).](/cms/asset/8e9e134f-d981-4b80-9533-e2c664af2065/dddt_a_12299732_f0003_c.jpg)
Figure 4 Plot of the individual and population predictions versus observations for the final model.
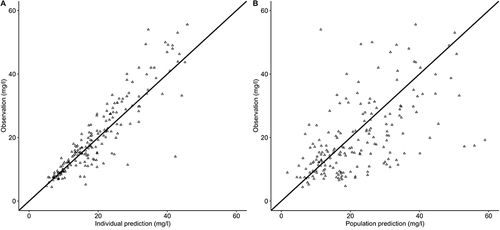
Figure 5 Visual predictive check (VPC) for vancomycin concentration versus time after first record for the final model. The dashed and solid black lines represent the 5th, 50th, and 95th percentiles of the observed data. The shaded regions represent the 95% confidence intervals around the 5th, 50th, and 95th percentiles of the simulated data.
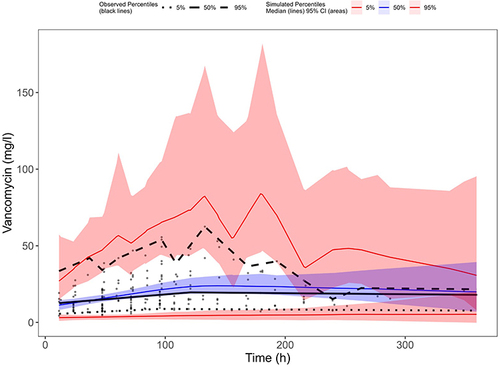
Figure 6 Bootstrap result for final model.
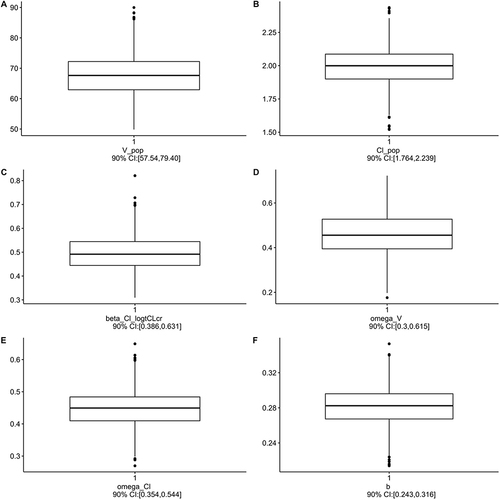
Table 4 Optimal Maintenance Dose Based on Simulations with the Final Model
Table 5 PK/PD Simulation for Probability of Target Attainment > 90%