
Figures & data
Figure 1 Characteristics of nano-dispersions containing TRO. (A) Particle distribution and (B) SPM image of dispersions containing milled-TRO. (C) Photographs and (D) stability of dispersions containing TRO exposed (milled-TRO) or not exposed (TRO-sus) to bead milling. n=8. *P<0.05 vs TRO-sus for each category (Student’s t-test). The particle size of milled-TRO was in the range of 50–220 nm, and the stability of dispersions was enhanced by bead milling.
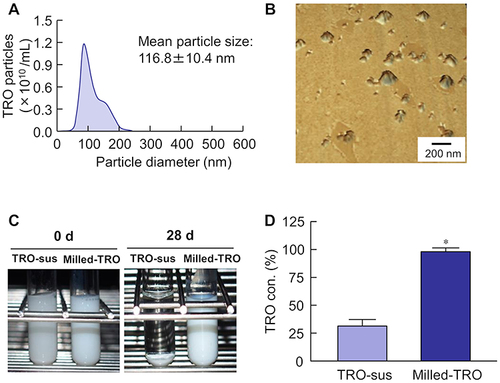
Figure 2 Changes in the XRD pattern and DTA of TRO exposed (milled-TRO) or not exposed (TRO-sus) to bead milling. (A) XRD pattern of TRO powder. (B) XRD pattern of additives; dispersions contained TRO exposed (milled-TRO) or not exposed (TRO-sus) to bead milling. (C) DTA pattern of TRO powder; dispersions contained TRO exposed (milled-TRO) or not exposed (TRO-sus) to bead milling. XRD and DTA patterns of TRO were altered by the bead milling.
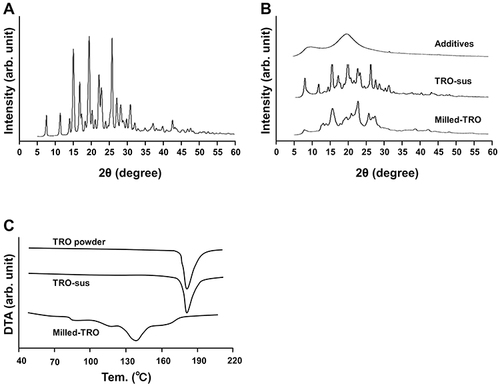
Figure 3 Condition of TRO in gels. (A) Photographs of TRO-MP and TRO-NP gels. (B) Particle size distribution and (C) SPM images of TRO-MP and TRO-NP gels. The particle size of TRO in the TRO-NP gel is in the range of 50–280 nm.
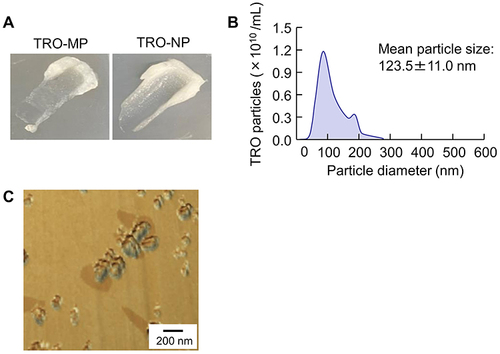
Figure 4 Characteristics of TRO-MP and TRO-NP gels. (A) Non-uniformity in TRO particles of TRO-MP and TRO-NP gels. (B) Drug solubility, (C) viscosity, and (D) zeta potential of TRO-MP and TRO-NP gels. n=10. *P<0.05 vs TRO-MP gel for each category (Student’s t-test). #P<0.05 vs vehicle for each category (Tukey–Kramer test). #P<0.05 vs TRO-MP gel for each category. †P<0.05 vs TRO-MP gel for each category (Tukey–Kramer test). The uniformity of TRO particles and viscosity of the TRO-NP gel were higher than those of the TRO-MP gel. Conversely, the solubility and zeta potential of TRO was similar in TRO-MP and TRO-NP gels.
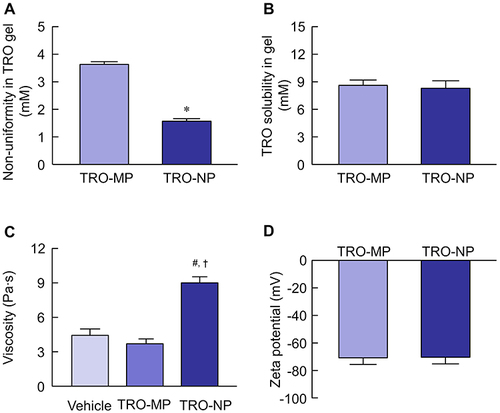
Figure 5 Drug release from TRO-MP and TRO-NP gels through a 220 nm pore membrane. (A) Release behavior of TRO from TRO-MP and TRO-NP gels. (B) Size distribution and (C) number of TRO nanoparticles in the reservoir chamber 24 h after the application of TRO-NP gels. n=6. N.D., not detectable. *P<0.05 vs TRO-MP gel for each category (Student’s t-test). The release of TRO from the TRO-NP gel was higher than that from the TRO-MP gel; TRO nanoparticles were detected in the reservoir chamber 24 h after the application of TRO-NP gel.
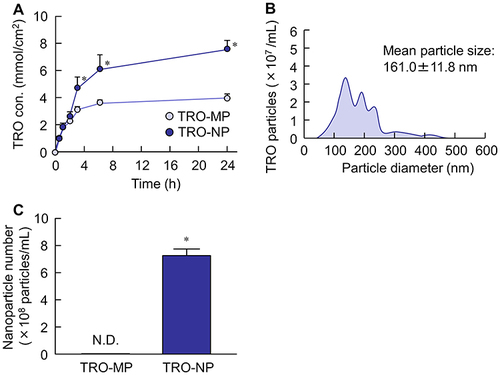
Figure 6 Effect of endocytosis on the content of TRO in cheek pouches of hamsters with OM after treatment with TRO gels. (A) Changes in TRO content in the cheek pouches of hamsters 3 h and 8 h after treatment with TRO gels (TRO-MP at 3 h and 8 h, n=5×2=10; TRO-NP at 3 h and 8 h, n=5×2=10). (B) Changes in TRO content in the cheek pouches of hamsters 3 h after co-treatment with endocytosis inhibitors and TRO-NP gel. Control, TRO-NP gel-treated hamsters (n=5). Each endocytosis inhibitor-treated hamster [nystatin (n=5), dynasore (n=5), rottlerin (n=5), cytochalasin D (n=5)] was co-treated with TRO-NP gel. Total n=45. *P<0.05 vs TRO-MP gel for each category (Student’s t-test). #P<0.05 vs control for each category (Tukey–Kramer test). TRO nanoparticles were taken up via the CME pathway, and TRO levels in the cheek pouches of hamsters treated with the TRO-NP gel were higher than those treated with the TRO-MP gel.
![Figure 6 Effect of endocytosis on the content of TRO in cheek pouches of hamsters with OM after treatment with TRO gels. (A) Changes in TRO content in the cheek pouches of hamsters 3 h and 8 h after treatment with TRO gels (TRO-MP at 3 h and 8 h, n=5×2=10; TRO-NP at 3 h and 8 h, n=5×2=10). (B) Changes in TRO content in the cheek pouches of hamsters 3 h after co-treatment with endocytosis inhibitors and TRO-NP gel. Control, TRO-NP gel-treated hamsters (n=5). Each endocytosis inhibitor-treated hamster [nystatin (n=5), dynasore (n=5), rottlerin (n=5), cytochalasin D (n=5)] was co-treated with TRO-NP gel. Total n=45. *P<0.05 vs TRO-MP gel for each category (Student’s t-test). #P<0.05 vs control for each category (Tukey–Kramer test). TRO nanoparticles were taken up via the CME pathway, and TRO levels in the cheek pouches of hamsters treated with the TRO-NP gel were higher than those treated with the TRO-MP gel.](/cms/asset/e4e173be-cf04-4f58-b103-ed92f857bce8/dddt_a_12297803_f0006_c.jpg)
Figure 7 Changes in the wound area in the cheek pouches of hamsters with OM 0–3 days after treatment with TRO gels. (A) Representative images and (B) wound area of cheek pouches treated with TRO gels. Bar in the image (A) indicate 1 mm. Total n=23 [none, n=8; vehicle (n=5), TRO-MP (n=5), and TRO-NP gels (n=5)]. *P<0.05 vs vehicle for each category (Tukey–Kramer test). #P<0.05 vs TRO-MP gel for each category (Tukey–Kramer test). The therapeutic effect of the TRO-NP gel was higher than that of the TRO-MP gel in the cheek pouches of hamsters with OM.
![Figure 7 Changes in the wound area in the cheek pouches of hamsters with OM 0–3 days after treatment with TRO gels. (A) Representative images and (B) wound area of cheek pouches treated with TRO gels. Bar in the image (A) indicate 1 mm. Total n=23 [none, n=8; vehicle (n=5), TRO-MP (n=5), and TRO-NP gels (n=5)]. *P<0.05 vs vehicle for each category (Tukey–Kramer test). #P<0.05 vs TRO-MP gel for each category (Tukey–Kramer test). The therapeutic effect of the TRO-NP gel was higher than that of the TRO-MP gel in the cheek pouches of hamsters with OM.](/cms/asset/878311da-f8cd-46fd-9928-c466acb239ce/dddt_a_12297803_f0007_c.jpg)
Data Sharing Statement
The data generated in the present study may be requested from the corresponding author.