Figures & data
Figure 1 Scheme of the study design describing the three groups of animals treated over eight weeks with: standard diet and oral vehicle (control group); choline-deficient high fat diet plus diethylnitrosamine (CDHFD + DEN) and oral vehicle (nonalcoholic steatohepatitis group); and CDHFD + DEN and oral S-nitroso-N-acetylcysteine (SNAC) solution (1.4 mg/kg) (SNAC group).
Figure 2 (A and B) Ultraviolet-visible spectral changes associated with the formation of S-nitroso-N-acetylcysteine (SNAC) through the S-nitrosation of N-acetylcysteine (NAC) with nitrous acid showing the two absorption bands characteristic of primary S-nitrosothiols with maxima at 336 and 545 nm. The concentration of the SNAC solution is 1 and 40 mM, respectively. (C) Kinetic curve of SNAC formation during the S-nitrosation of NAC based on the absorption band of SNAC at 545 nm. Inset: SNAC structure. (D) Kinetic curve of SNAC decomposition in simulated gastric fluid at a concentration of 1 mM, pH 1.5 and 37°C over 4 hours based on the absorption band of SNAC at 336 nm.
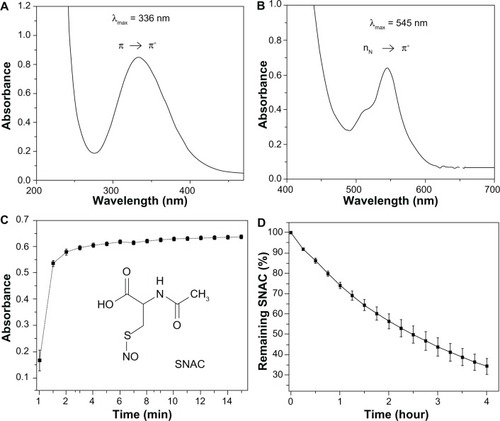
Figure 3 Representative picrosirius red staining images of hepatic histology of (A) control, (B) nonalcoholic steatohepatitis (NASH), and (C) S-nitroso-N-acetylcysteine (SNAC) treated animals. Magnification is × 200. (D) Collagen quantification of the control, SNAC, and NASH groups.
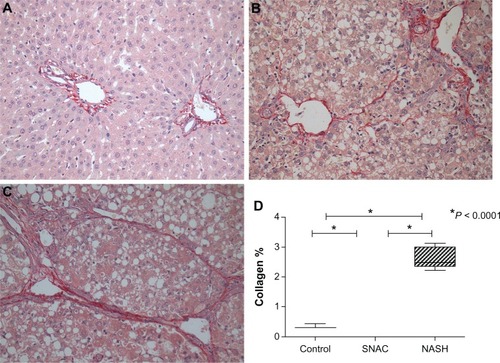
Figure 4 Representative nitrotyrosine immunostaining of liver sections.
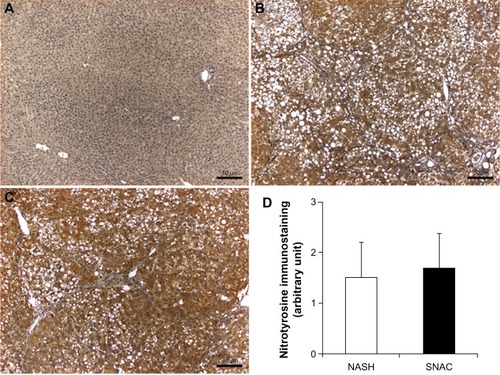
Figure 5 Fold change in matrix metalloproteinase (MMP)-13 and -9, and tissue inhibitor of metalloproteinases (TIMP)-1 and -2 mRNA expression in the nonalcoholic steatohepatitis groups against S-nitroso-N-acetylcysteine groups.
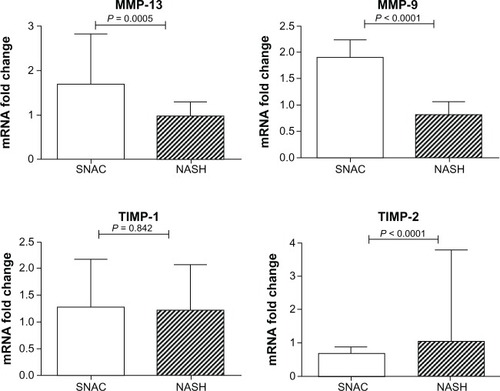
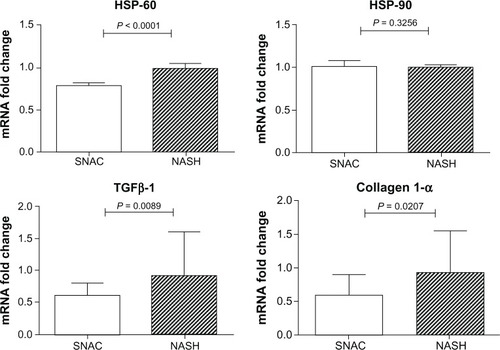
Figure 6 Fold change in heat-shock protein (HSP)-60 and -90, transforming growth factor β-1, and collagen 1α mRNA expression in the nonalcoholic steatohepatitis groups against S-nitroso-N-acetylcysteine groups.