
Figures & data
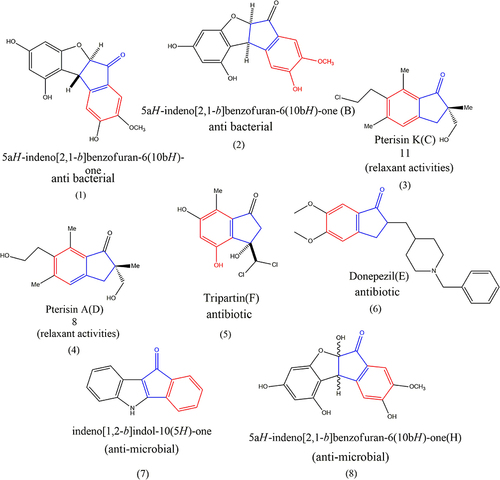
Figure 1 Typical natural products based on 2.3-dihydro-1 H inden-1-one.
Scheme 1 The synthesis of anthraquinone- cyclopentanone derivatives (1–8).
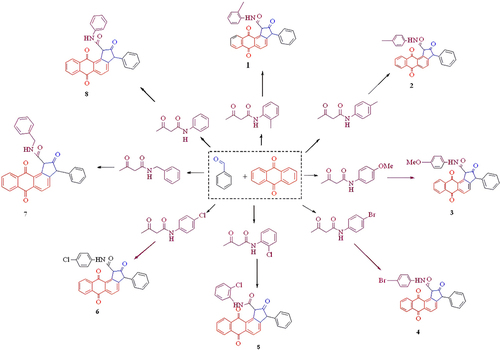
Table 1 Tyrosinase from Mushrooms Inhibitory Functions of Substances (1–8) and Standard Kojic Acid
Figure 2 Percentage of Tyrosinase Inhibitory activities of synthesized compounds (1–8) at concentration 100 µg/mL.
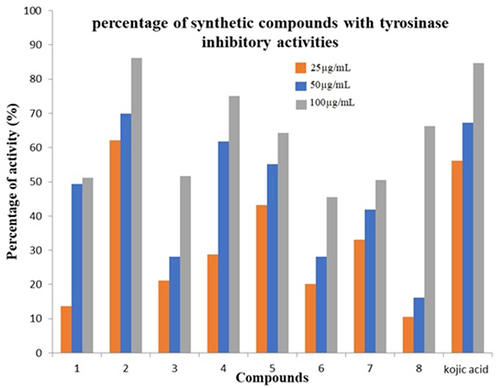
Figure 3 LineweavereBurk plot for the inhibition of tyrosinase activity by compound 1. Concentrations 0 µM, 21.17 µM, 52.94 µM, 105.89 µM and 211.79 µM were used for analysis compound 1.
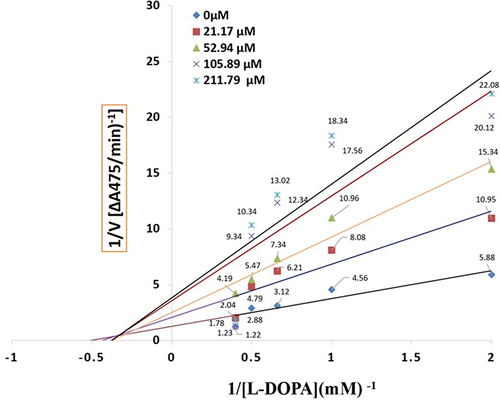
Figure 4 Lineweavere Burk plot for the inhibition of tyrosinase activity by compound 2. Concentrations 0 µM, 21.11 µM, 21.17 µM, 52.94 µM and 105.89 µM were used for analysis compound 2.
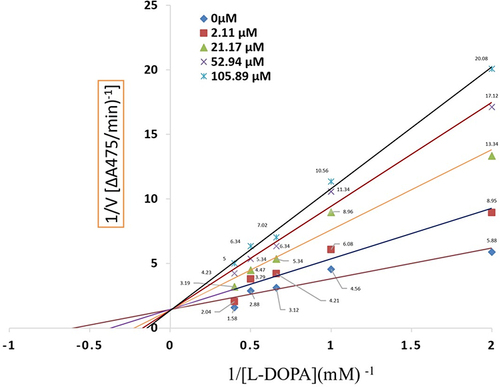
Table 2 Antioxidant Activity of Compounds (1–8)
Table 3 Antibacterial Activities of Synthesized Compounds (1–8)
Table 4 Cytotoxic Activities of Compounds (1–8)
Table 5 Docked Result of Compound 2 and Drug with 2Y9X Using XP Method
Figure 5 Molecular docking studies on (A) compound 1 (3D Structure), (B) compound 1 (2D Structure) compound 1 docked with 2Y9X protein.
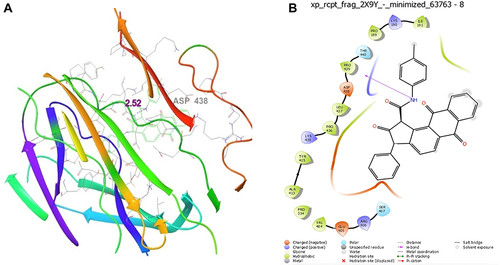
Figure 6 Molecular docking studies on (A) Kojic acid (3D Structure), (B) Kojic acid (2D Structure) standard Kojic acid docked with 2Y9X protein.
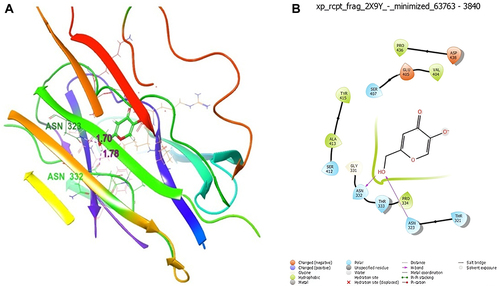
Figure 7 RMSD plot of 2Y9X with compound 2.
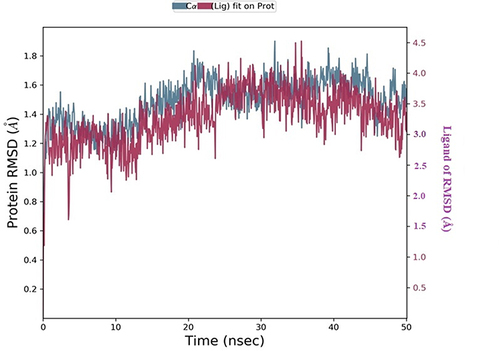
Figure 8 RMSF plot of 2Y9Xwith Compound 2.
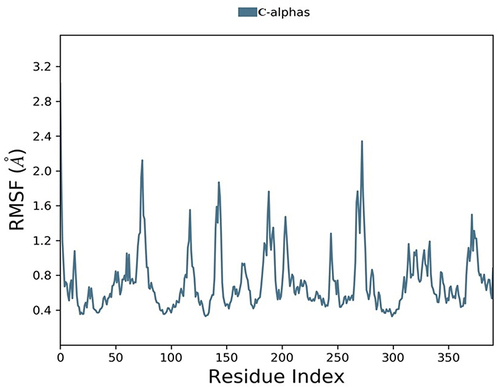
Figure 9 Histogram of protein-ligand contacts of 2Y9X with compound 2.
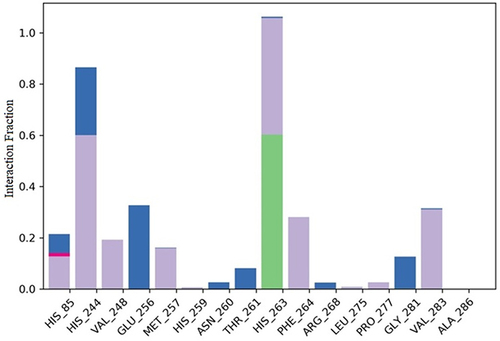
Figure 10 Timeline representation of protein-ligand contacts of 2Y9X with compound 2. #The Number of conducts.
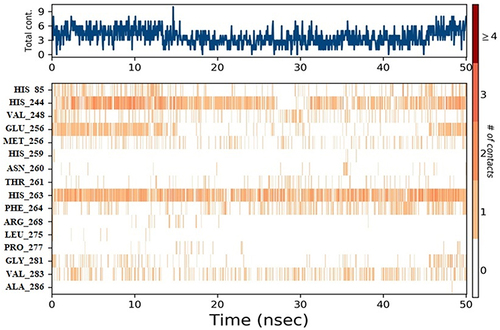
Table 6 Comparison of Highly Active Compounds and the Structure-Activity Relationship