Figures & data
Figure 1 How did we connect the dots? Hypothesis and design of multitargeting compounds. (A) Drug–phytochemical interactions identified using combination assays. Green arrows signify synergistic interaction of phytochemicals (protocatechuic acid and gallic acid, represented as blue arrowhead) in combination with sulfonamide antibiotics (sulfamethoxazole and sulfadiazine, represented as violet arrowhead). Sulfonamides block the dihydropteroate synthase enzyme, while the phytochemicals target the subsequent enzyme dihydrofolate reductase (DHFR) in the folate biosynthesis pathway leading to a synergistic effect. Red arrows signify indifferent interaction of phytochemicals (protocatechuic acid and gallic acid, represented as blue arrowhead) in combination with fluoroquinolone antibiotics (ciprofloxacin, represented as orange arrowhead). Ciprofloxacin binds to DNA gyrase subunit A (GyrA) and topoisomerase IV subunit A (ParC), while phytochemicals target the subunit B (GyrB and ParE) of both these enzymes leading to an indifferent effect via equivalent action of DNA replication inhibition; (B) Knowledge-based approach was used to establish relationship between therapeutic targets (GyrB/ParE and DHFR) identified based on our previous drug–phytochemical interaction network. Mechanism of action of epigallocatechin gallate (plant flavonoid, red arrowhead) and previously reported sulfonamide derivatives targeting GyrB/ParE and DHFR enzymes, gives an illustration of the ability of these compounds to bind to the identified target sets. Derived common pharmacophoric features for multi-inhibition of GyrB/ParE and DHFR enzymes based on the previously reported individual pharmacophore models; (C) Schematic illustration of the fragment combination method used to derive the hybrid compounds, phytochemicals (blue arrowhead) linked with sulfonamide groups (violet arrowhead) using noncleavable linker (orange line) that can simultaneously bind to GyrB/ParE and DHFR enzymes.
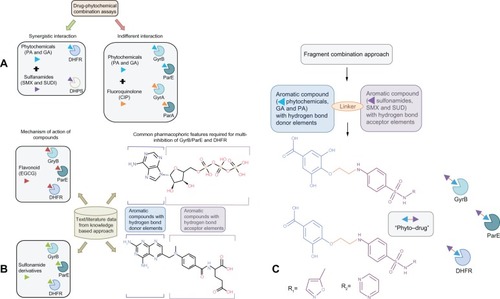
Table 1 Calculated toxicity risks, molecular properties, drug likeness, and overall drug score of the compounds investigated
Figure 2 Structures of the designed hybrid compounds, “phyto-drug” (phytochemicals–antibiotics conjugates, (A) PD_1a; (B) PD_1b; (C) PD_2a; (D) PD_2b.
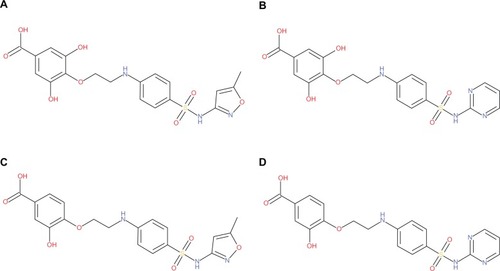
Table 2 Calculated absolute energies, stereoelectronic, and molecular properties at B3LYP/6-3IG** basis set levels, and percentage of absorption of the designed hybrid compounds
Figure 3 Representations of (A) HOMO (B) LUMO and (C) Molecular electrostatic potential (MEP) isodensity surfaces calculated at B3LYP/6-31G** basis set levels on the optimized geometry of the hybrid compounds.
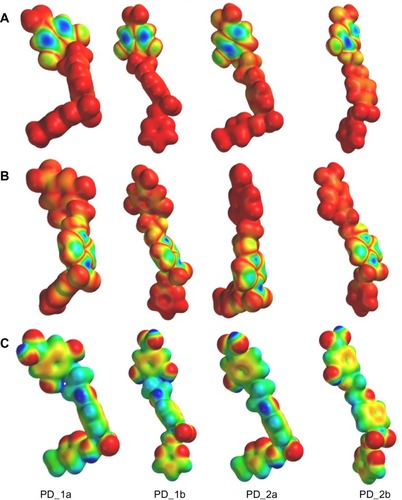
Table 3 Docking results of ADPNP and designed hybrid compounds (ranked on the basis of binding affinity scores) at the ATP binding site in P. aeruginosa GyrB
Table 4 Docking results of methotrexate and designed hybrid compounds (ranked on the basis of binding affinity scores) at the folate binding site in P. aeruginosa DHFR
Figure 4 Binding modes of ADPNP and methotrexate in P. aeruginosa GyrB and DHFR active site cavities obtained from docking studies. (A) The nonhydrolyzable analog of ATP (ADPNP) (yellow stick model) docked at ATP binding site of GyrB; (B) DHFR inhibitor methotrexate (yellow stick model) docked at folate binding site of DHFR and the cofactor NADP is shown as aqua stick model.
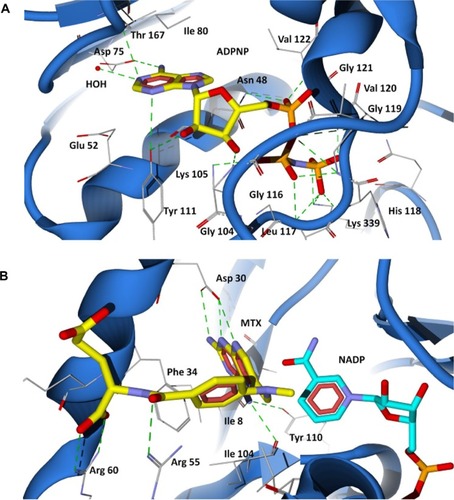
Figure 5 Docking of designed hybrid compounds at ATP binding site of P. aeruginosa GyrB. (A) Binding pose of the top scored compound PD_2a (grey stick model); (B) PD_2a and PD_2b (stick model colored by their element) superimposed with ADPNP (yellow stick model).
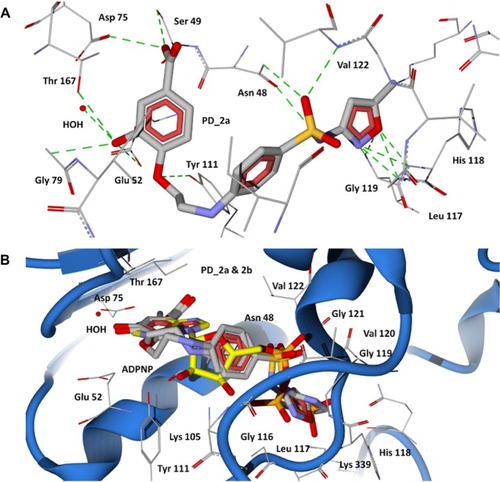
Figure 6 Docking of designed hybrid compounds at ATP binding site of P. aeruginosa GyrB. (A) Binding pose of the top scored compound PD_1a (grey stick model); (B) PD_1a and PD_1b (stick model colored by their element) superimposed with ADPNP (yellow stick model).
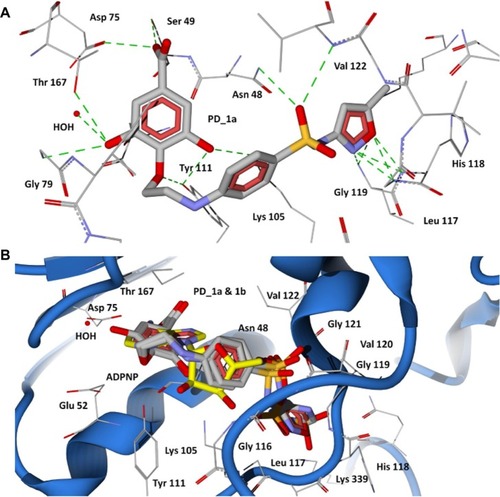
Figure 7 Docking of designed hybrid compounds at folate binding site of P. aeruginosa DHFR. (A) Binding pose of the top scored compound PD_2a (grey stick model); (B) PD_2a and PD_2b (stick model colored by their element) superimposed with methotrexate (yellow stick model), and cofactor NADP is represented as aqua stick model.
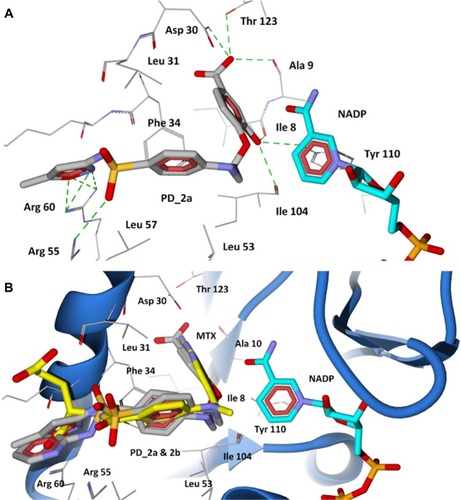
Figure 8 Docking of designed hybrid compounds at folate binding site of P. aeruginosa DHFR. (A) Binding pose of the top scored compound PD_1a (grey stick model); (B) PD_1a and PD_1b (stick model colored by their element) superimposed with methotrexate (yellow stick model), and cofactor NADP is represented as aqua stick model.
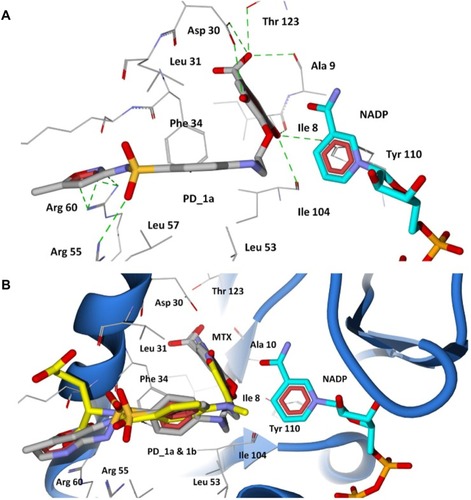
Figure 9 Root mean square deviation (RMSD) of backbone Cα atoms of the complexes versus time in picoseconds. (A) Unbound GyrB complex – I, ADPNP bound GyrB complex – II and top scored hybrid compound PD_2a bound GyrB complex-III; (B) Unbound DHFR complex – IV, methotrexate and cofactor NADP bound DHFR complex – V and top scored hybrid compound PD_2a and cofactor NADP bound DHFR complex – VI.
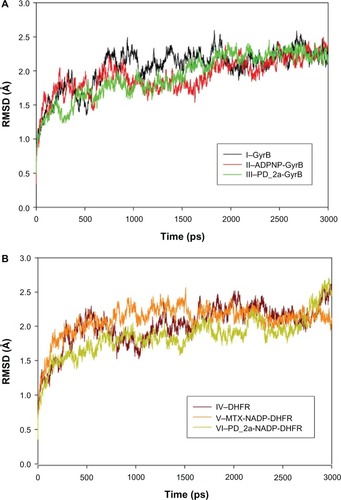
Figure 10 Root mean square fluctuation (RMSF) of backbone Cα atoms of the complexes versus residue number in the sequence. (A) Unbound GyrB complex – I, ADPNP bound GyrB complex – II and top-scored hybrid compound PD_2a bound GyrB complex – III; (B) Unbound DHFR complex – IV, methotrexate and cofactor NADP bound DHFR complex – V and top-scored hybrid compound PD_2a and cofactor NADP bound DHFR complex – VI; (C) Closer look of GyrB active site residues RMSF during the simulation of three complexes; (D) Closer look of DHFR active site residues RMSF during the simulation of three complexes.
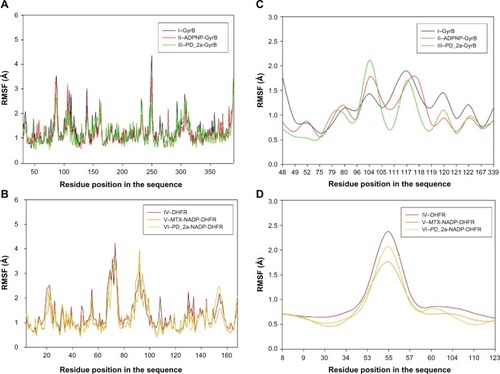
Figure S1 Alignment of target (P. aeruginosa) sequence and E. coli template protein sequence. (A) DNA Gyrase subunit B (GyrB) with template (PDB: 1EI1). (B) Topoisomerase IV subunit B (ParE) with template (PDB: 1S16). (C) Dihydrofolate reductase (DHFR) with template (PDB: 1RX3).
Figure S2 Superimposition between P. aeruginosa homology models and the template crystal structures. (A) GyrB model (blue) and template structure E. coli (1EI1, red) bound with ADPNP (yellow stick model). (B) ParE model (blue) and template structure E. coli (1S16, green) bound with ADPNP (magenta stick model). (C) DHFR model (blue) and template structure E. coli (1RX3, green) bound with the inhibitor methotrexate (yellow stick model), and NADP cofactor (aqua stick model).
Note: Active site residues are shown as wireframe colored by their element.
Figure S3 Validation of P. aeruginosa GyrB homology model (A) Ramachandran plot and (B) ProSA (protein structure analysis) energy plot.
Figure S4 Validation of P. aeruginosa ParE homology model (A) Ramachandran plot and (B) ProSA (protein structure analysis) energy plot.
Figure S5 Validation of P. aeruginosa DHFR homology model (A) Ramachandran plot and (B) ProSA (protein structure analysis) energy plot.
Figure S6 Docking of designed hybrid compounds at ATP binding site of P. aeruginosa ParE. (A) Binding pose of the top-scored compound PD_2a (grey stick model) (B) PD_2a and PD_2b (stick model colored by their element) superimposed with ADPNP (magenta stick model).
Notes: The residues are shown as wireframe colored by their element and labeled in white. The hydrogen bonds are illustrated as dotted green lines. The water molecule in both (A) and (B) is shown as a red colored ball model.
Figure S7 Docking of designed hybrid compounds at ATP binding site of P. aeruginosa ParE. (A) Binding pose of the top-scored compound PD_1a (grey stick model). (B) PD_1a and PD_1b (stick model colored by their element) superimposed with ADPNP (magenta stick model).
Notes: The residues are shown as wireframe colored by their element and labeled in white. The hydrogen bonds are illustrated as dotted green lines. The water molecule in both (A) and (B) is shown as a red colored ball model.
Figure S8 Root mean square deviation (RMSD) of backbone Cα atoms of the complexes versus time in picoseconds. Unbound ParE complex – VII, ADPNP bound ParE complex – VIII and top-scored hybrid compound PD_2a bound ParE complex – IX.
Figure S9 Root mean square fluctuation (RMSF) of backbone Cα atoms of the complexes versus residue number in the sequence. (A) Unbound ParE complex – VII, ADPNP bound ParE complex – VIII and top-scored hybrid compound PD_2a bound ParE complex – IX; (B) Closer look of ParE active site residues RMSF during the simulation of three complexes.
Table S1 Docking results of ADPNP and designed hybrid compounds (ranked on the basis of binding affinity scores) at the ATP binding site in P. aeruginosa ParE