Figures & data
Figure 1 The network diagram of disease-herb-active ingredient-target. The red rectangle represents disease; the green diamond represents 12 herbs of ANPCD; the yellow triangle represents 48 active plasma components of ANPCD and the blue ellipse represents targets.
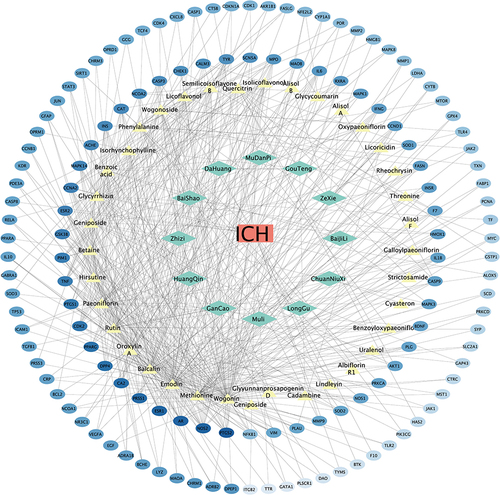
Figure 2 NP, transcriptome data difference analysis and PPI analysis screened 48 potential therapeutic target genes of ANPCD against ICH. (A) Volcano map of differential analysis between sham and ICH in transcriptome data set (GSE206971). (B) Venn diagram of overlapping genes between DEGs, targets of ANPCD and targets of ICH. (C) The PPI network diagram of 48 candidate genes, in which the darker colors represent higher Degree value. (D) Ranking bar chart of Degree value in PPI network graph, in which the horizontal axis represents Degree.
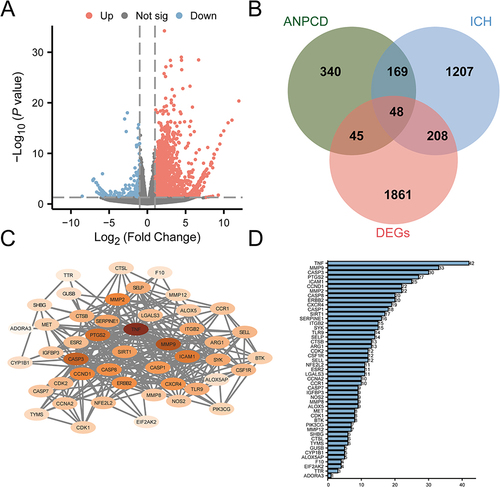
Figure 3 The cluster analysis of 15 core genes and PPI network diagram of each of cluster. (A) Heat map of 15 core genes. (B) PPI network diagram of cluster1. (C) PPI network diagram of cluster2. (D) PPI network diagram of cluster3.
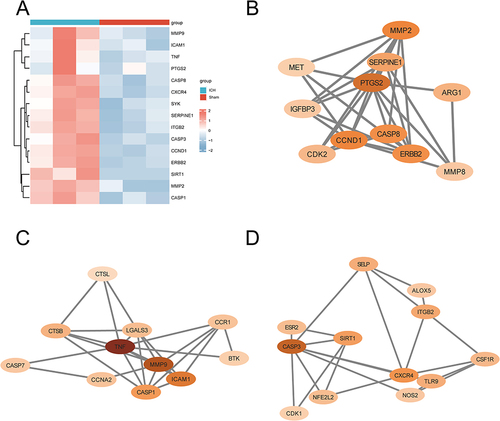
Table 1 The Signaling Pathway Regulated by the Compounds of ANPCD
Figure 4 Functional enrichment analysis of 48 candidate genes. (A) GO enrichment analysis of 48 candidate genes in BP, MF and CC. (B) KEGG enrichment analysis of 48 candidate genes. (C) Gene-pathway network diagram. (D) The chord diagram represents the combined results of log 2 (Fold Change) values, genes and pathways. The left side represents genes, while the right side represents pathways.
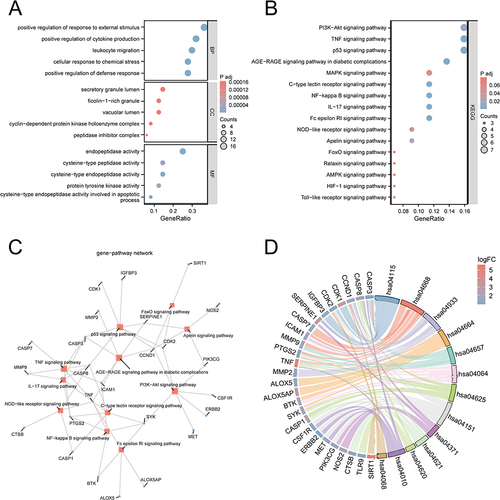
Table 2 Molecular Docking Energy Between 8 Active Compounds of ANPCD and Core Gene-Related Protein SIRT1
Figure 5 The macromolecular docking between SIRT1 and six active components that ANPCD. (A) macromolecular docking of SIRT1 with Phenylalanine. (B) macromolecular docking of SIRT1 with Licorice. (C) macromolecular docking of SIRT1 with Rhynchophylline. (D) macromolecular docking of SIRT1 with Hirsutine. (E) macromolecular docking of SIRT1 with Wogonin. (F) macromolecular docking of SIRT1 with Oroxylin A.
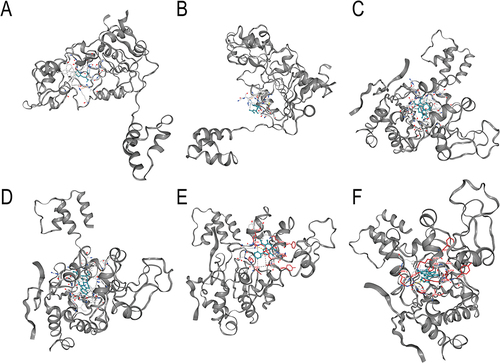
Figure 6 ANPCD and ED decreased neurological deficit scores and serum MDA and 8-OHdG content, but increased serum SOD and CAT activity at 72 h after ICH in rats. (A) mNSS score. (B) serum MDA content. (C) serum 8-OHdG content. (D) serum SOD activity. (E) serum CAT activity. * p < 0.05 or ** p < 0.01 as compared with the sham group; # p < 0.05 or ## p < 0.01 as compared with the ICH group.
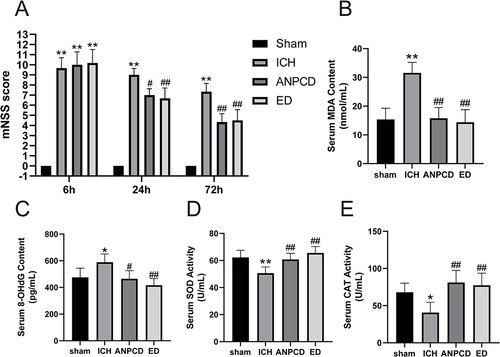
Figure 7 ANPCD and ED up-regulated the protein expression of SIRT1, FOXO1, PGC-1α and Nrf2 in brain tissue around hematoma at 72 h after ICH by immunofluorescence staining; Scale bars = 50 μm (100 ×). (A) Immunofluorescence of SIRT1 (green) and DAPI (blue). (B) Immunofluorescence of FOXO1 (green) and DAPI (blue). (C) Immunofluorescence of PGC-1α (green) and DAPI (blue). (D) Immunofluorescence of Nrf2 (green) and DAPI (blue). (E) Relative fluorescence intensity of SIRT1. (F) Relative fluorescence intensity of FOXO1. (G) Relative fluorescence intensity of PGC-1α. (H) Relative fluorescence intensity of Nrf2. * p < 0.05 or ** p < 0.01 as compared with the sham group; # p < 0.05 or ## p < 0.01 as compared with the ICH group.
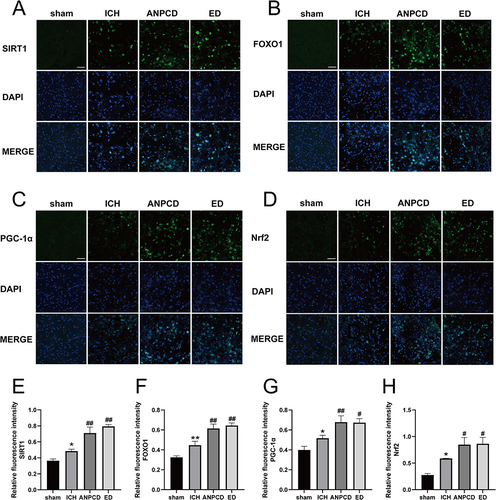
Figure 8 ANPCD and ED up-regulated the protein expression of SIRT1, FOXO1, PGC-1α and Nrf2 in brain tissue around hematoma at 72 h after ICH by Western blot. (A) The protein expression of SIRT1, FOXO1, PGC-1α and Nrf2. (B) The quantitative densitometric ratio of SIRT1. (C) The quantitative densitometric ratio of FOXO1. (D) The quantitative densitometric ratio of PGC-1α. (E) The quantitative densitometric ratio of Nrf2. * p < 0.05 or ** p < 0.01 as compared with the sham group; #p < 0.05 or ## p < 0.01 as compared with the ICH group.
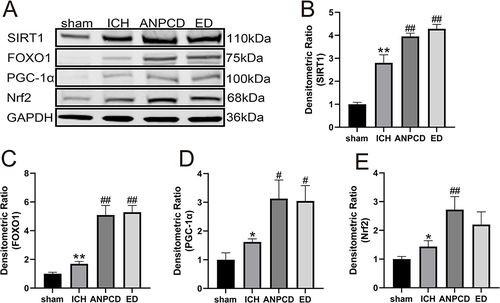
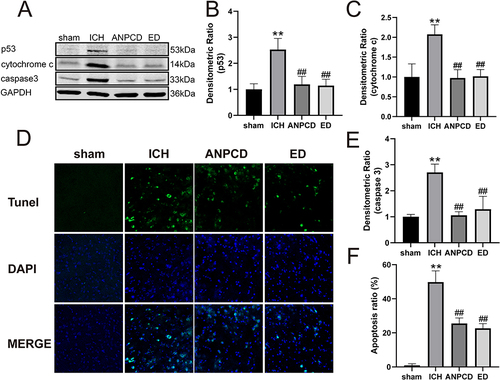
Figure 9 ANPCD and ED decreases the apoptosis rate and the expression of P53, cytochrome c and caspase-3. (A) The protein expression of P53, cytochrome c and caspase-3. (B) The quantitative densitometric ratio of P53. (C) The quantitative densitometric ratio of cytochrome c. (D) TUNEL staining with fluorescence of brain tissue at 72 h after ICH. (E)The quantitative densitometric ratio of caspase-3. (F) Apoptosis rate. ** p < 0.01 as compared with the sham group; ## p < 0.01 as compared with the ICH group.