
Figures & data
Table 1 Histopathological Data of Hepatic Tissue (Median [IQR])
Figure 1 Representative light microscopy of hepatic tissue from the control group. Normal liver tissue.
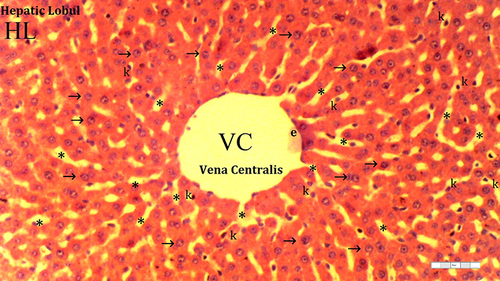
Figure 2 Representative light microscopy of hepatic tissue from the dexmedetomidine group.
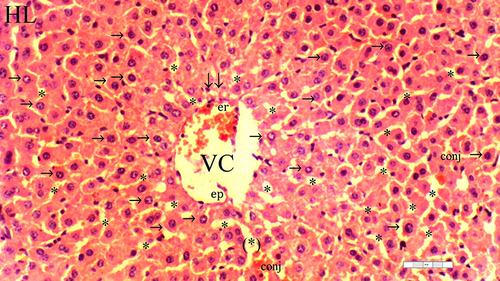
Figure 3 Representative light microscopy of hepatic tissue from the ischemia-reperfusion group.
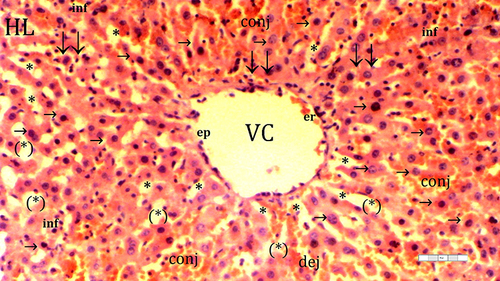
Figure 4 Representative light microscopy of hepatic tissue from dexmedetomidine ischemia-reperfusion group.
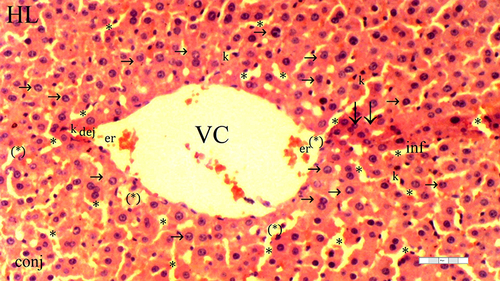
Table 2 Histopathological Data of the Kidney Tissue (Median [IQR])
Figure 5 Representative light microscopy of kidney tissue from the control group. Normal kidney tissue.
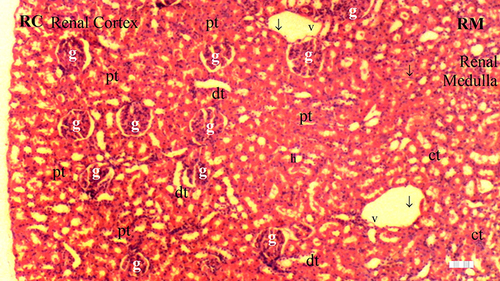
Figure 6 Representative light microscopy of kidney tissue from the dexmedetomidine group.
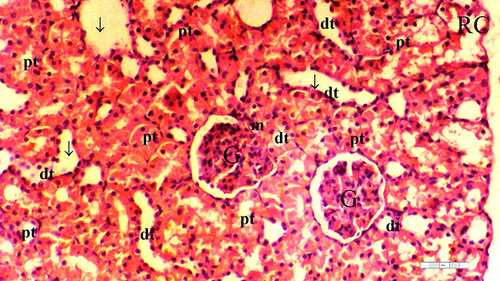
Figure 7 Representative light microscopy of kidney tissue from ischemia/reperfusion group.
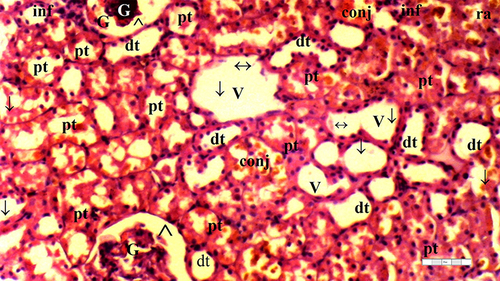
Figure 8 Representative light microscopy of kidney tissue from the dexmedetomidine ischemia-reperfusion group.
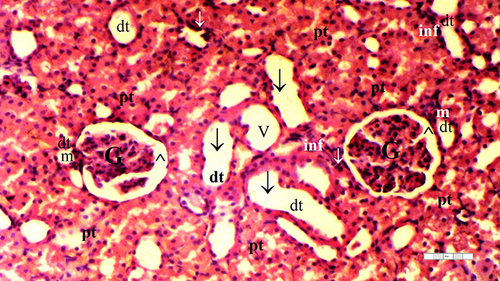
Table 3 Antioxidant Enzyme Activities and Oxidant (TBARS) Levels (Mean ± SD) in Liver Tissue
Table 4 Antioxidant Enzyme Activities and Oxidant (TBARS) Levels (Mean ± SD) in Kidney Tissues
Table 5 Serum AST, ALT, GGT, BUN, Creatinine Levels (Mean ± SD)