Figures & data
Table 1 Primer Pairs Used for Detection of EV71 and Host Cells
Table 2 Details of HPLC Assay
Figure 1 Cytotoxicity (A), EV71 RNA expression level (B), and anti-EV71 effect (C) of aqueous solution of Changyanning (CYN) tablets. (D) Anti-EV71 effect of positive control ribavirin. (A) Cytotoxicity induced by the aqueous solution of CYN tablets on RD cells. (B) RD cells were infected with 0.01 MOI EV71 and treated with different concentrations of CYN solution or ribavirin (1 mg/mL) for 24 h. Quantitative real-time PCR (qRT-PCR) was performed to test EV71 VP1 RNA level. The expression of VP1 transcripts was calculated with the expression level of β-actin mRNA. **significant with P < 0.01 compared to VC. (C) CYN solution inhibited cell deaths induced by 0.01 MOI EV71. (D) Ribavirin inhibited cell deaths induced by 0.01 MOI EV71.
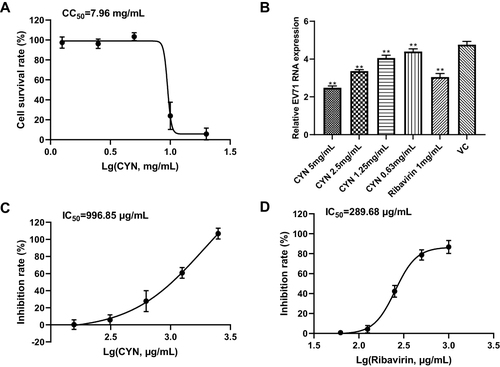
Figure 2 Effects of aqueous extract of five herbal ingredients and ribavirin on the RNA expression of EV71(A), and anti-EV71 effect of AEMC (B) and AELLF (C). (A) RD cells were infected with 0.01 MOI EV71 and treated with five herbal ingredients or ribavirin (1 mg/mL) for 24 h. qRT-PCR was performed to test EV71 VP1 RNA level. The expression of VP1 transcripts was calculated with the expression level of β-actin mRNA. ns, not significant with P > 0.05; **, significant with P < 0.01 compared to VC. (B) Aqueous extract of MC inhibited cell deaths induced by 0.01 MOI EV71. (C) Aqueous extract of LLF inhibited cell deaths induced by 0.01 MOI EV71.
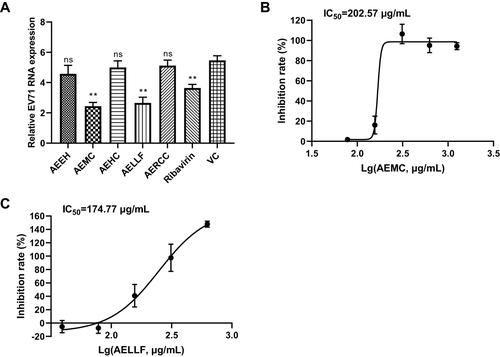
Figure 3 Ion chromatogram of AEMC (A) and AELLF (B) analyzed by HPLC-Q-TOF-MS/MS, and the structural formula of the 11 common components (C–F). (A) The total ion chromatogram of AEMC. (B) The total ion chromatogram of AELLF. (C) The structural formulas of seven organic acids. (D) The structural formulas of two flavonoids. (E) The structural formulas of amino acid. (F) The structural formulas of tannin. 9, gallic acid; 17, neochlorogenic acid; 19, chlorogenic acid; 22, cryptochlorogenic acid; 23, caffeic acid; 35, hyperoside; 37, rutin; 38, rosmarinic acid; 42, astragalin.
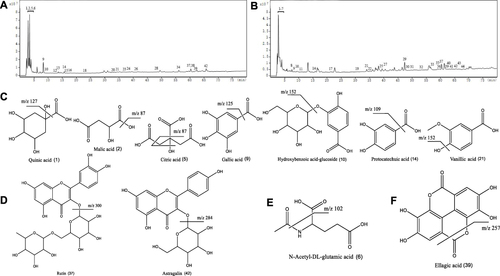
Figure 4 Venn plot. Venn plot was constructed based on the related targets of 34 identified components and the EV71-related targets retrieved from three databases. The 29 intersection targets were marked with the red box.
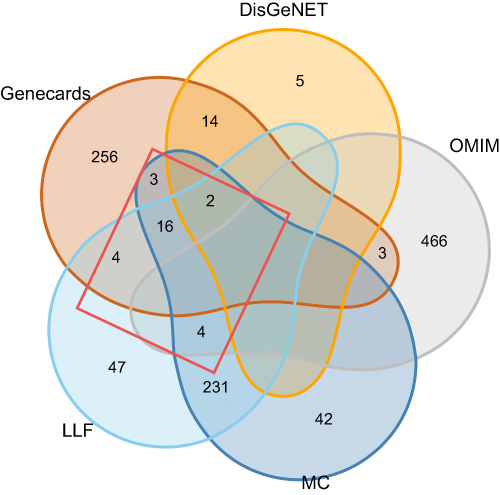
Figure 5 Component-target-pathway-disease network. The component-target-pathway-disease network diagram. Red represents the herbal ingredients MC and LLF. Green represents the 34 identified components. Blue represents EV71. Purple represents the common targets in three. And yellow represents the related pathway.
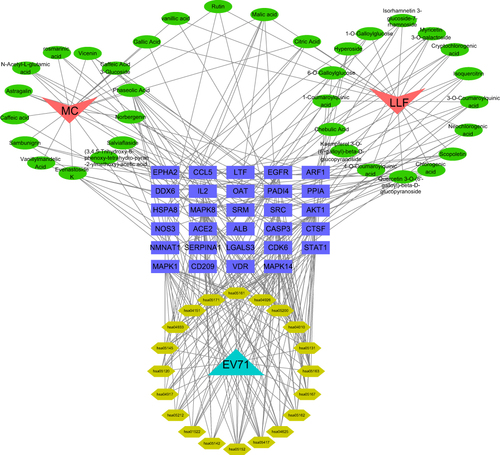
Figure 6 Protein–Protein Interaction (PPI) network diagram. The redder the color, the larger the circle, indicating that the target correlation is stronger.
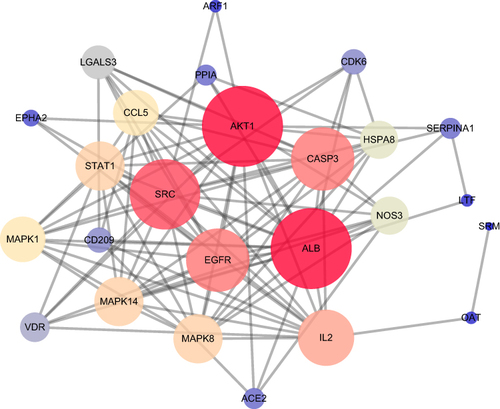
Table 3 The MNTC of the Nine Components Selected for Pharmacodynamic Verification
Figure 7 The docking scores of components and core targets. The redder the color, the lower the binding energy between the component and the target, and the component may bind tightly to the target.
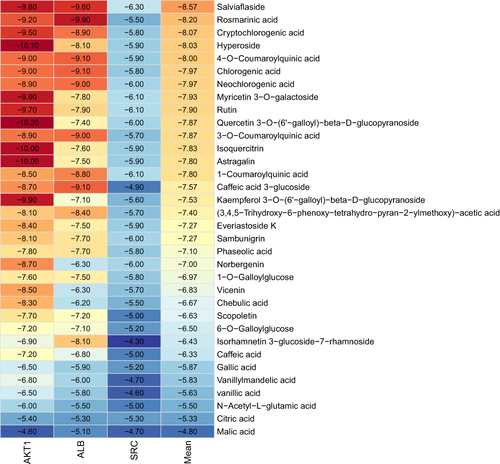
Figure 8 Effects of nine components and ribavirin on the RNA expression of EV71 (A), and anti-EV71 effect of rosmarinic acid (B). (A) RD cells were infected with 0.01 MOI EV71 and treated with nine components or ribavirin (1 mg/mL) for 24 h. qRT-PCR was performed to test EV71 VP1 RNA level. The expression of VP1 transcripts was calculated in relation to the expression level of β-actin mRNA. ns, not significant with P > 0.05; **, significant with P < 0.01 compared to VC. (B) Rosmarinic acid inhibited cell deaths induced by 0.01 MOI EV71.
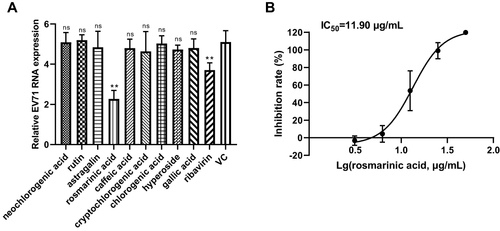
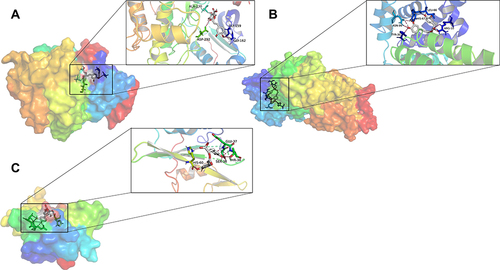
Figure 9 Binding pattern of rosmarinic acid to AKT1 protease(A), ALB protease(B), and SRC protease(C). (A) Binding pattern of rosmarinic acid to AKT1. (B) Binding pattern of rosmarinic acid to ALB. (C) Binding pattern of rosmarinic acid to SRC.