Figures & data
Figure 1 Explanatory figure relating to the experimental protocol.
Notes: Two holes were drilled through the left side of the skull, one for KCl application (1) and the other for direct current-electrocorticogram recording (2). The two holes were also drilled in the histological part of this study. The parallel black lines represent the location of the analyzed sections. The rectangles on the right side of the picture show the sites of the digital images captured after Evans blue staining.
Abbreviation: KCl, potassium chloride.
Abbreviation: KCl, potassium chloride.
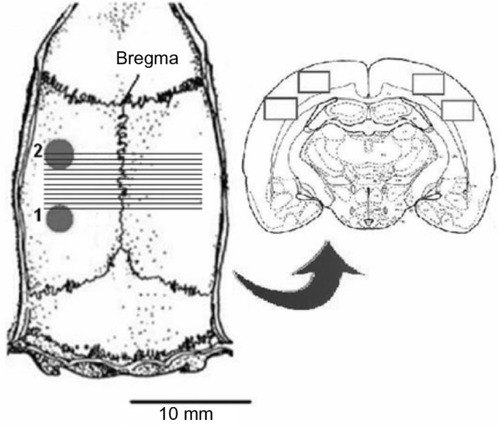
Figure 2 Fluorescence intensity changes caused by plasma extravasation in the three groups.
Notes: Each dot represents a mean intensity ratio (± standard error of the mean) of ten pictures, which were taken from the two hemispheres at the same distance from the KCl application area. There was no significant difference between the groups according to repeated-measures one way ANOVA.
Abbreviations: ANOVA, analysis of variance; CSD, cortical spreading depression; KYNA, kynurenic acid; MK-801, dizocilpine; KCl, potassium chloride.
Abbreviations: ANOVA, analysis of variance; CSD, cortical spreading depression; KYNA, kynurenic acid; MK-801, dizocilpine; KCl, potassium chloride.
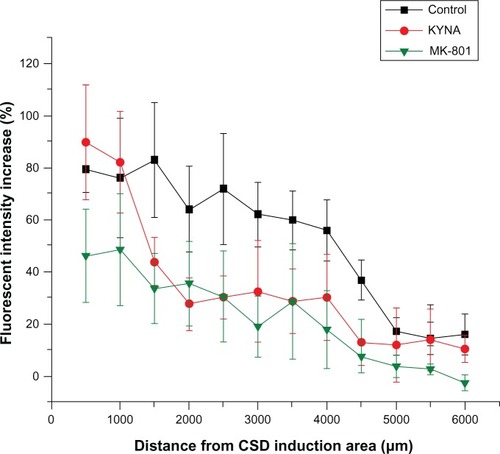
Figure 3 Diagrams of cortical spreading depression (CSD) wave parameters.
Notes: (A) Box diagrams of CSD frequency. The squares inside the boxes indicate the means of the samples. CSD frequency expressed in waves per hour. A significant difference between the control and the kynurenic acid (KYNA)-treated group was indicated by the two-sample t-test. **P < 0.01. Dizocilpine (MK-801) completely blocked the CSD waves. (B) CSD wave amplitudes in mV. No significant difference was detected by two-sample t-test. (C) Time at half-amplitude in seconds. Two-sample t-test was performed (**P < 0.01) between the control and treated group. (D) Diagram of CSD area. Two-sample t-test was performed (**P < 0.01) between the control and kynurenic acid (KYNA) groups.
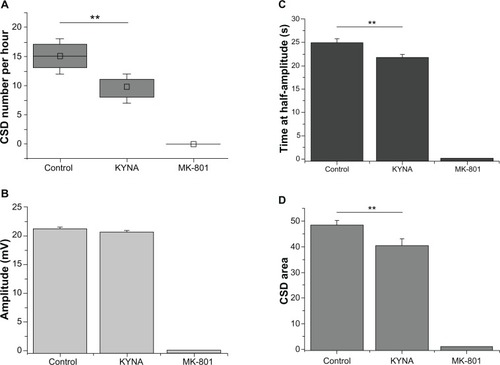
Figure 4 Representative cortical spreading depression (CSD) waves recorded in the barrel cortex.
Notes: The uppermost measurement is from a phosphate buffer-treated animal. The CSD wave frequency and the time at half-amplitude were reduced by kynurenic acid (KYNA) treatment, as shown by the second registration. Dizocilpine (MK-801) completely blocked the initiation of the waves. Scale bar: 1 minute; 5 mV.
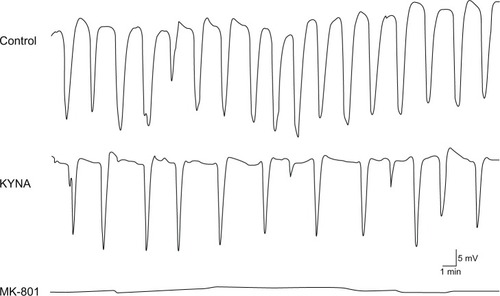
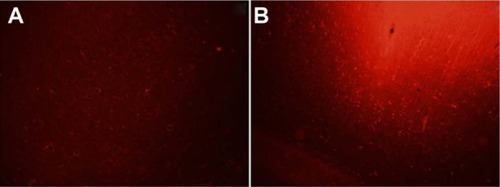
Figure 5 Representative photomicrographs of the cerebral cortex.
Notes: The images were taken from a control animal at 1000 μm from the area of cortical spreading depression induction. There was a massive increase in fluorescent intensity on the KCl treated hemisphere (B) compared to the contralateral cortex (A). Magnification 20×.
Abbreviation: KCl, potassium chloride.
Abbreviation: KCl, potassium chloride.