Figures & data
Figure 1 Monitoring the enrichment of Cell-SELEX progression. (A) Scheme of systematic enrichment of aptamers against CRPC cells; (B) Binding of enriched pools to C4-2 cells (positive cells) and (C) LNCaP cells (negative cells) from the 4th, 8th, 11th and 14th rounds was monitored by flow cytometry. The Lib represents a random DNA sequence as negative control.
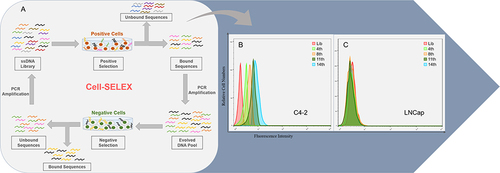
Table 1 Sequences of Aptamer CRda8 and CRda21
Figure 2 Binding of the selected aptamers to C4-2 cells analyzed by flow cytometry (n = [1 + 6×6] × 3). (A) The binding ability of CRda7, CRda8, CRda11, CRda14 and CRda21 with C4-2 cells were respectively evaluated by flow cytometry. (B) Quantitative analysis of binding affinity of 5 selected aptamer candidates with C4-2 cells. The Lib represents a random DNA sequence as negative control. Data represented as mean ± standard deviation (The experiments were repeated three times independently). ***P < 0.001.
![Figure 2 Binding of the selected aptamers to C4-2 cells analyzed by flow cytometry (n = [1 + 6×6] × 3). (A) The binding ability of CRda7, CRda8, CRda11, CRda14 and CRda21 with C4-2 cells were respectively evaluated by flow cytometry. (B) Quantitative analysis of binding affinity of 5 selected aptamer candidates with C4-2 cells. The Lib represents a random DNA sequence as negative control. Data represented as mean ± standard deviation (The experiments were repeated three times independently). ***P < 0.001.](/cms/asset/44eae0b3-e9b0-41ed-8a31-db432c886250/dddt_a_12301364_f0002_c.jpg)
Figure 3 Predicted secondary structures of aptamer candidates CRda8 (A) and CRda21 (B).
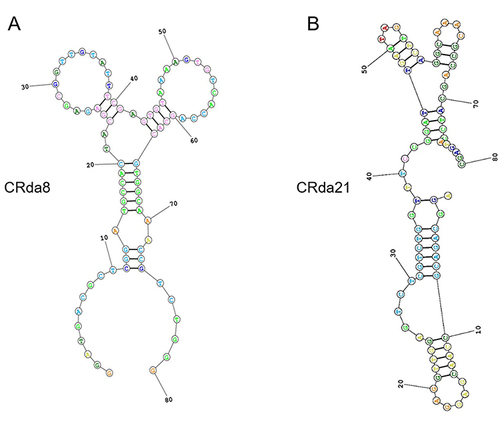
Figure 4 Effect of incubation temperature on binding ability of aptamers. (A) C4-2 cells were respectively incubated with FAM-labeled aptamers at 4 °C or 37 °C and analyzed by confocal laser scanning microscope; LNCaP cells were used as negative control. (B) Dissociation constant (Kd) of aptamers for C4-2 cells at 4 °C or 37 °C were respectively measured by flow cytometry. Scale bars correspond to 50 μm in images.
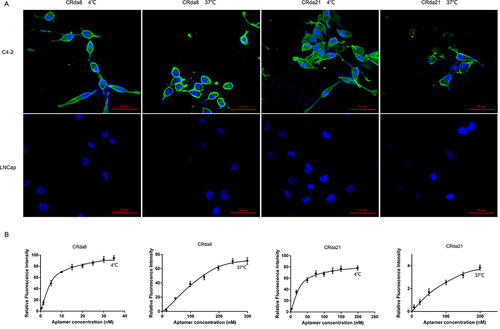
Figure 5 The specificity assay of the aptamers to different cell lines by confocal laser scanning microscope ((A and B); n = 3×8 × 6×3) and flow cytometry ((C and D); n = [3 × 6 +1] × 6×3). The Lib represents a random DNA sequence as negative control. Scale bars correspond to 50 μm in images. Data represented as mean ± standard deviation. The experiments were repeated three times independently. ***P < 0.001.
![Figure 5 The specificity assay of the aptamers to different cell lines by confocal laser scanning microscope ((A and B); n = 3×8 × 6×3) and flow cytometry ((C and D); n = [3 × 6 +1] × 6×3). The Lib represents a random DNA sequence as negative control. Scale bars correspond to 50 μm in images. Data represented as mean ± standard deviation. The experiments were repeated three times independently. ***P < 0.001.](/cms/asset/612bab9f-ffde-4164-a34c-84f60a1ceeaf/dddt_a_12301364_f0005_c.jpg)
Figure 6 The clinical pathological human prostate tissues slides stained by FAM-labeled aptamers (n = 2×6 × 3×3). (A) Images in the first row showed HE staining of paraffin section from clinical pathological tissues of BPH, ADPC (Gleason score: 3+4) and CRPC (Gleason score: 5+5), respectively. Weak fluorescence signal was observed on BPH and ADPC tissues slides. Strong fluorescence signal was observed on CRPC tissues slides. (B) Quantitative analysis of specific immunofluorescence staining of CRPC tissues. HE staining represents hematoxylin and eosin staining; BPH represents benign prostatic hyperplasia; CRPC represents castration resistant prostate cancer; ADPC represents androgen dependent prostate cancer. Scale bars correspond to 50 μm in all images. Data represented as mean ± standard deviation. The experiments were repeated three times independently. **P < 0.01.
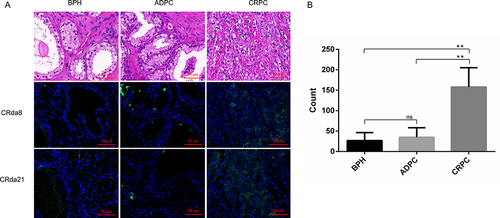
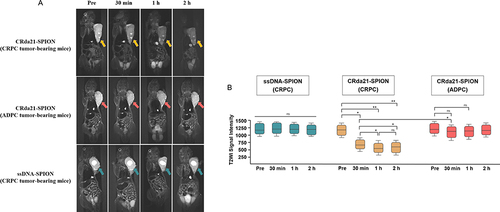
Figure 7 In vivo subcutaneous CRPC and ADPC model MR imaging at pre-injection, and at 30 minutes, 1 hour and 2 hours post-injection of the probes (n = 32). (A) Images of CRPC tumor-bearing mice, which showed significant T2WI signal intensity decrease of tumors (yellow arrows) after injection of CRda21-SPION. Images of ADPC tumor-bearing mice showed the T2WI signal intensity in the tumor site (red arrows) slightly decreased after the injection of CRda21-SPION. CRPC tumor-bearing mice injected with ssDNA-SPION was used as negative control and there were no significant T2WI signal intensity changes in the tumor site (green arrows). (B) Quantitative signal intensity measurement of T2WI for the tumors at different time points. The data were presented as median with interquartile range (IQR). *P < 0.05, **P < 0.01.
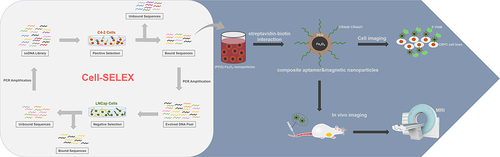
Scheme 1 Schematic representation of the process for the research including the process of aptamer selection, aptamer-magnetic nanoparticles conjugation, probe imaging in vitro and in vivo.