Figures & data
Table 1 The Demographic Data, Baseline Characteristics, Intraoperative Details and Maternal Side Effect
Figure 1 Flow diagram of study.
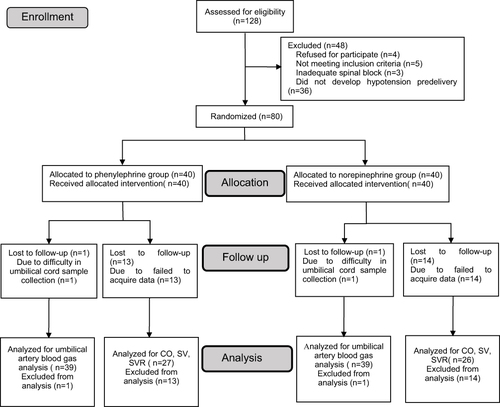
Table 2 Neonatal Outcomes
Table 3 Baseline Hemodynamics Obtained by the TL-400. Hemodynamic Data Were Not Available for 25 Patients
Figure 2 Changes in cardiac output (CO) for all patients plotted against time. Values on the x-axis corresponded to the number of each consecutive CO measurement made with the TL-400 monitor set to record at 1-min.
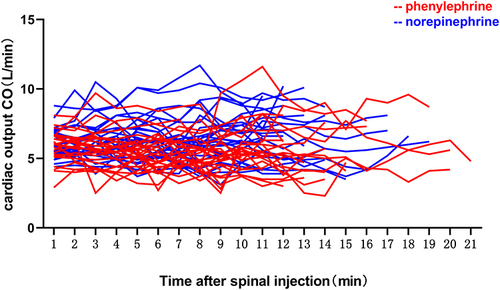
Figure 3 Bars show the area under the curve (AUC) for the two groups standardized for each patient by dividing by the number of data points recorded. Comparison of the calculated values for standardized AUC showed that CO was greater over time in the norepinephrine group versus the phenylephrine group (P = 0.009).
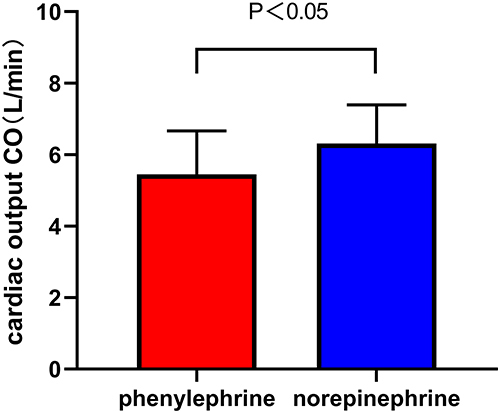
Figure 4 Serial changes in mean arterial pressure (MAP) for the first 12 minutes after subarachnoid block, data are presented as mean and standard deviation(SD). The value at time 0 corresponds to the baseline value.
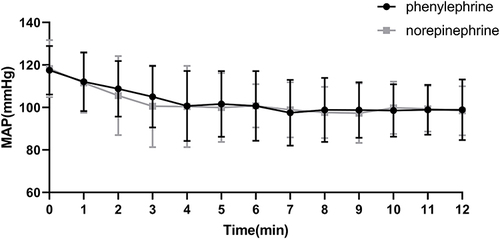
Figure 5 Serial changes in heart rate (HR) for the first 12 minutes after subarachnoid block, data are presented as mean and SD. The value at time 0 corresponds to the baseline value.
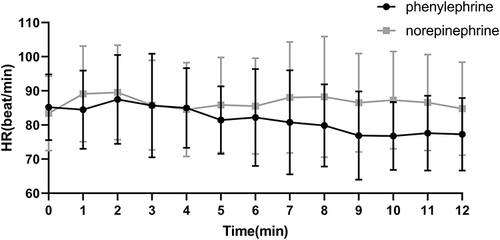
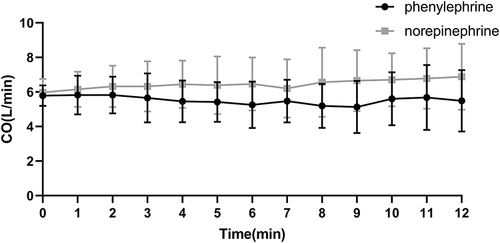
Figure 6 Serial changes in CO for the first 12 minutes after subarachnoid block, data are presented as mean and SD. The value at time 0 corresponds to the baseline value.