Figures & data
Table 1 Description of primers used in real-time polymerase chain reaction
Figure 1 Flow cytometric immunophenotype analysis of stem cells derived from primitive fetal cells present in human amniotic fluid (hAFSCs). Undifferentiated hAFSCs were stained with primary antibodies specific for stemness markers (Oct4, Sox2, Nanog), MSC markers (CD44, CD29, CD105, CD90), or hemopoietic markers (CD45, CD133, CD34) and with fluorescein isothiocyanate-conjugated secondary antibody. The graphics show the immunophenotype analysis (mean ± standard error of the mean; n = 6; P < 0.05).
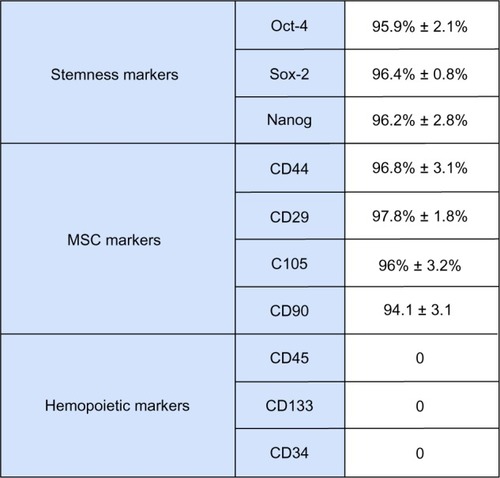
Figure 2 Effect of HA + BU + RA on expression of genes specific for cardiogenic, angiogenic, and smooth muscle in stem cells derived from primitive fetal cells present in human amniotic fluid. Cells were exposed for 1, 2, 3, 7, and 10 days in the absence or presence of HA 2 mg/mL + BU 5 mM + RA 1 μM. The mRNA amounts of prodynorphin, Nkx-2.5, GATA-4, Tbx-5, Mef2C, α-sarcomeric actinin, α-myosin heavy chain, cTNT, VEGF, HGF, vWF, smooth muscle actin, and calponin from HA + BU + RA-treated or untreated cells were normalized to GAPDH, and the mRNA expression levels in HA + BU + RA-treated cells was plotted at each time point as fold change relative to expression in untreated control cells, defined as 1. All the HA + BU + RA-treated cells at each time point were significantly different from untreated control cells (mean ± standard error of the mean; n = 6; P < 0.05).
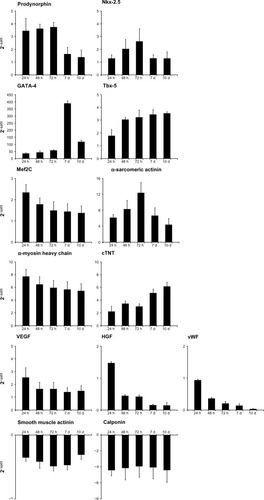
Figure 3 Effects on stem cells derived from primitive fetal cells present in human amniotic fluid (hAFSCs) of exposure to a mixture of HA + BU + RA on pluripotency gene transcription. hAFSCs were exposed for 1, 2, 3, 7, or 10 days in the absence or presence of HA 2 mg/mL + BU 5 mM + RA 1 μM. The mRNA amounts of Sox2, Oct4, and Nanog from HA + BU + RA-treated or untreated cells were normalized to GAPDH, and the mRNA expression levels in HA + BU + RA-treated cells were plotted at each time point as fold change relative to expression in untreated control cells, defined as 1. All the HA + BU + RA-treated cells at each time point were significantly different from untreated control cells (mean ± standard error of the mean; n = 6; P < 0.05).
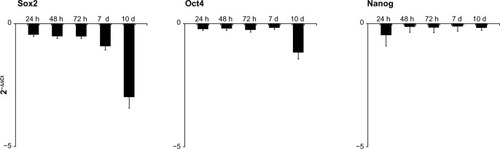
Figure 4 Exposure of stem cells derived from primitive fetal cells present in human amniotic fluid (hAFSCs) to HA + BU + RA modulates expression of selected, tissue-restricted, and stemness-related proteins. Total lysates were isolated from hAFSCs cultured for different periods of time, ie, 24, 48, and 72 hours, and 7 and 10 days, in the absence [−(HA + BU + RA)] or presence [+(HA + BU + RA)] of HA 2 mg/mL + BU 5 mM + RA 1 μM. Samples were analyzed by Western blot, using polyclonal antisera against GATA4, Nkx-2.5, Tbx-5, Mef2C, α-sarcomeric actinin, MHC, cTNT, VEGF, HGF, vWF, SMA, calponin, Sox2, Oct4, and Nanog and GAPDH. The sizes of the bands were determined using prestained marker proteins. The data presented are representative of five separate experiments.
![Figure 4 Exposure of stem cells derived from primitive fetal cells present in human amniotic fluid (hAFSCs) to HA + BU + RA modulates expression of selected, tissue-restricted, and stemness-related proteins. Total lysates were isolated from hAFSCs cultured for different periods of time, ie, 24, 48, and 72 hours, and 7 and 10 days, in the absence [−(HA + BU + RA)] or presence [+(HA + BU + RA)] of HA 2 mg/mL + BU 5 mM + RA 1 μM. Samples were analyzed by Western blot, using polyclonal antisera against GATA4, Nkx-2.5, Tbx-5, Mef2C, α-sarcomeric actinin, MHC, cTNT, VEGF, HGF, vWF, SMA, calponin, Sox2, Oct4, and Nanog and GAPDH. The sizes of the bands were determined using prestained marker proteins. The data presented are representative of five separate experiments.](/cms/asset/53f9a785-c51b-45f1-a8c4-cb45cf586b86/dddt_a_44706_f0004_b.jpg)
Figure 5 HA + BU + RA treatment mediated differentiation of stem cells derived from primitive fetal cells present in human amniotic fluid. Expression of α-sarcomeric actinin, α-myosin heavy chain, cardiac troponin T, von Willebrand factor, and vascular endothelial growth factor was assessed in cells cultured in the absence [−(HA + BU + RA)] or presence [+(HA + BU + RA)] of HA 2 mg/mL + BU 5 mM + RA 1 μM for 10 days, and cultured for an additional one day in tissue chamber slides suitable for immunofluorescence staining. Images were obtained using a confocal microscope (TCSSP5, Leica, Nussloch, Germany) using a 20× objective. Nuclei are labeled with 4′,6-diamidino-2-phenylindole (DAPI, blue). Data shown are representative of five separate experiments.
![Figure 5 HA + BU + RA treatment mediated differentiation of stem cells derived from primitive fetal cells present in human amniotic fluid. Expression of α-sarcomeric actinin, α-myosin heavy chain, cardiac troponin T, von Willebrand factor, and vascular endothelial growth factor was assessed in cells cultured in the absence [−(HA + BU + RA)] or presence [+(HA + BU + RA)] of HA 2 mg/mL + BU 5 mM + RA 1 μM for 10 days, and cultured for an additional one day in tissue chamber slides suitable for immunofluorescence staining. Images were obtained using a confocal microscope (TCSSP5, Leica, Nussloch, Germany) using a 20× objective. Nuclei are labeled with 4′,6-diamidino-2-phenylindole (DAPI, blue). Data shown are representative of five separate experiments.](/cms/asset/f766ea04-c476-4fda-a086-9c6594527c00/dddt_a_44706_f0005_c.jpg)
Figure 6 Flow cytometry analysis of cell lineage marker expression in stem cells derived from primitive fetal cells present in human amniotic fluid (hAFSCs). The hAFSCs were cultured in the absence [−(HA + BU + RA)] or presence [+(HA + BU + RA)] of HA 2 mg/mL + BU 5 mM + RA 1 μM for 10 days. Cells were stained with primary antibodies specific for the marker of interest, in particular, α-sarcomeric actinin, α-MHC, and vWF, and with fluorescein isothiocyanate-conjugated secondary antibody. In order to validate the results, negative control samples, devoid of the antibody of interest, were used to set the basal fluorescence. The graphics show an increase in fluorescence and in the percentage of positively stained elements, corresponding to differentiated cells, as compared with untreated cells [−(HA + BU + RA)]. The data shown are representative of six individual experiments.
![Figure 6 Flow cytometry analysis of cell lineage marker expression in stem cells derived from primitive fetal cells present in human amniotic fluid (hAFSCs). The hAFSCs were cultured in the absence [−(HA + BU + RA)] or presence [+(HA + BU + RA)] of HA 2 mg/mL + BU 5 mM + RA 1 μM for 10 days. Cells were stained with primary antibodies specific for the marker of interest, in particular, α-sarcomeric actinin, α-MHC, and vWF, and with fluorescein isothiocyanate-conjugated secondary antibody. In order to validate the results, negative control samples, devoid of the antibody of interest, were used to set the basal fluorescence. The graphics show an increase in fluorescence and in the percentage of positively stained elements, corresponding to differentiated cells, as compared with untreated cells [−(HA + BU + RA)]. The data shown are representative of six individual experiments.](/cms/asset/9929c00f-48d6-443d-909f-03336d77601e/dddt_a_44706_f0006_c.jpg)
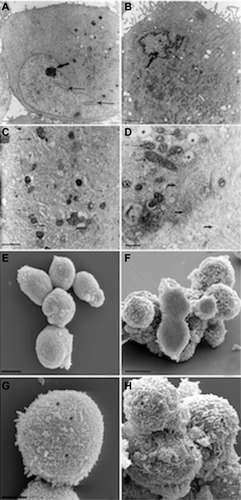
Figure 7 Morphologic analysis of stem cells derived from primitive fetal cells present in human amniotic fluid (hAFSCs) during HA + BU + RA-induced differentiation toward the cardiovascular phenotype. hAFSCs were cultured in the absence (A, C, E and G) or presence (B, D, F and H) of HA 2 mg/mL + BU 5 mM + RA 1 μM for 10 days. TEM analysis (A–D) or SEM analysis (E–H). (A) TEM imaging of untreated cells, 3,000x, scale bar 5 μm; (B) TEM imaging of HA + BU + RA-treated cells, 4,400x, scale bar 5 μm; (C) TEM imaging of untreated cells, 7,000x, scale bar 5 μm; (D) TEM imaging of treated cells, 12,000x, scale bar 1 μm; (E) SEM imaging of untreated cells, 1,600x, scale bar 10 μm; (F) SEM imaging of treated cells, 4,500x, scale bar 10 μm; (G) SEM imaging of untreated cells, 2,400x, scale bar 5 μm; (H) SEM imaging of treated cells, 8,000x, scale bar 5 μm. See text for more details.