
Figures & data
Figure 1 The effects of Notoginsenoside R1 on (A) TC, (B) TG, (C) LDL, (D) HDL and (E) ox-LDL. The data are shown as the mean ± SD (n = 8). ## p < 0.01, significantly different from control group. *p < 0.05 and ** p < 0.01, significantly different from model group.
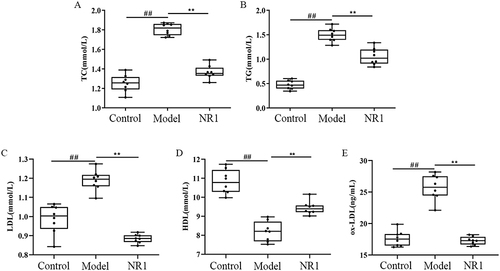
Figure 2 Impact of notoginsenoside R1 administration on aortic histopathological features in rats (200×). The abdominal aorta was extracted promptly upon rat euthanasia. We conducted Oil Red O staining and H&E staining to visualize plaque size and lipid content.
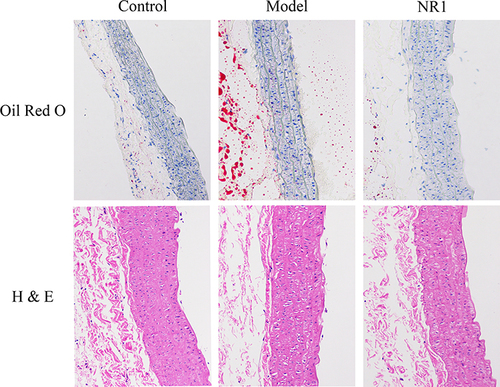
Figure 3 The effects of Notoginsenoside R1 on (A) IL-6, (B) IL-33, (C) IL-1β and (D) TNF-α. Results are manifested as the mean ± SD (n = 8). ## p < 0.01 versus control group; **p < 0.01 versus model group (n = 8).
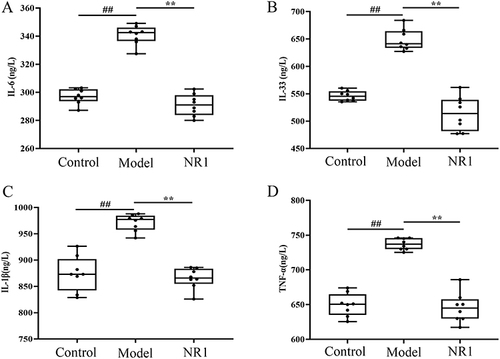
Figure 4 Impacts of notoginsenoside R1 on the adhesion molecule levels: (A)ICAM-1, (B)VCAM-1, (C)NO and (D)eNOS in AS rats. Results are expressed as the mean ± SD. ##p < 0.01 versus control group; **p < 0.01 versus model group (n = 8).
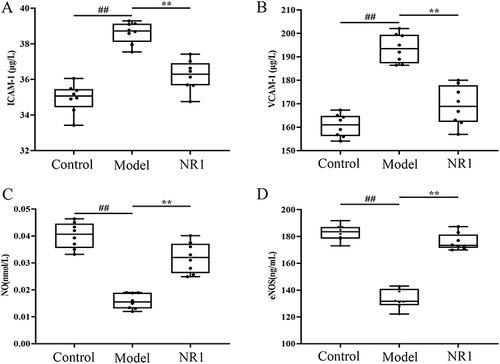
Figure 5 Notoginsenoside R1 inhibits activation and expression of NLRP3/Cleaved Caspase-1/IL-1β pathway in AS rats. (A) Expression levels of related protein expression were determined by the Western blot. Quantitative analysis of the expression of (B) NLRP3, (C) Cleaved Caspase-1, and (D) IL-1β, and β-Actin served as the internal control for protein analysis. All the values are represented by the means ± SD. ## p < 0.01 and # p < 0.05 versus control group; ** p < 0.01 and * p < 0.05 versus model group.

Figure 6 Notoginsenoside R1 modulates the expression of proteins related to endothelial factors. (A) Expression levels of related protein expression were ascertained by the Western blot. Quantitative analysis of the levels of (B) JNK2, (C) P38 MAPK, and (D) VEGF expression, and β-Actin was used the internal control of proteins. All data points are expressed by the means ± SD. ## p < 0.01 and # p < 0.05 versus control group; ** p < 0.01 and * p < 0.05 versus model group.
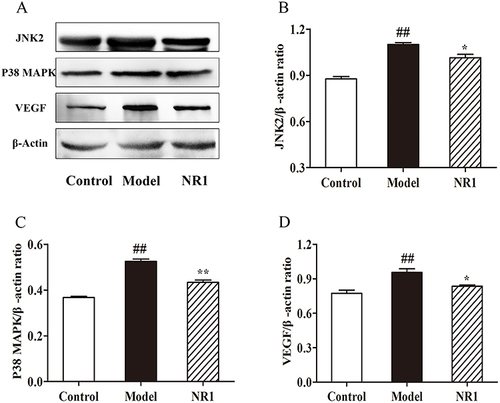
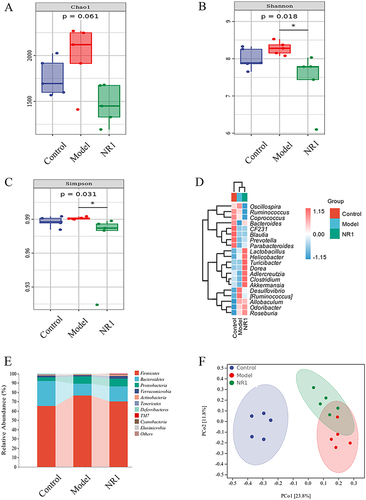
Figure 7 Notoginsenoside R1-mediated changes of gut microbiota in HFD combined with VD3-induced AS rats (n = 5). (A) Chao 1 indexes. (B) Shannon indexes. (C) Simpson indexes. (D) Heat map analysis of species composition. (E) Species compositions at the phylum level and (F) Principal coordinate analysis (PCoA) of all samples by weighted UniFrac distance.
Data Sharing Statement
The data used to support the findings of this study are included in the article.