Figures & data
Figure 1 Chemical structure of L-ascorbic acid (A), sirolimus (B), and paclitaxel (C).
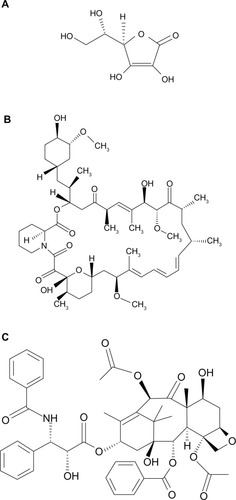
Figure 2 Endothelial cell viability and proliferation for L-ascorbic acid, sirolimus, paclitaxel, and controls.
Abbreviations: L-AA, L-ascorbic acid; PAT, paclitaxel; SIR, sirolimus.
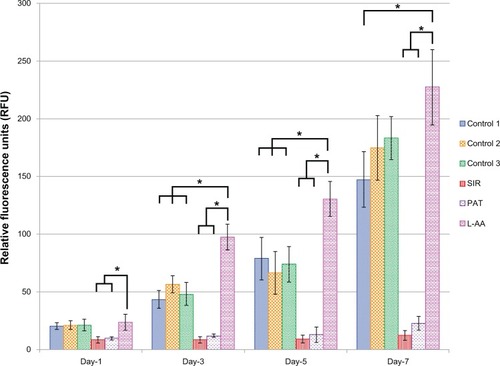
Figure 3 Fluorescence microscopy images of FDA stained ECs for L-AA, SIR, PAT, and controls (scale bar indicates 100 μm).
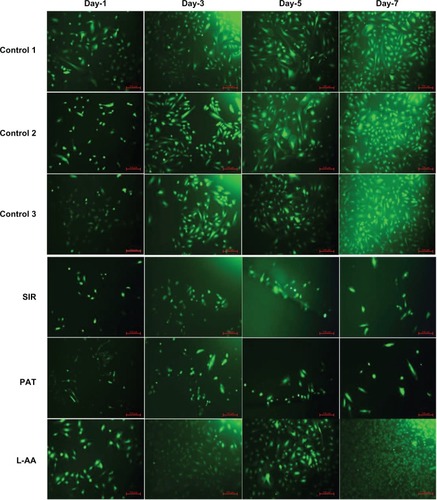
Figure 4 Phase contrast images of ECs for L-AA, SIR, PAT, and controls (A–F) (scale bar indicates 100 μm).
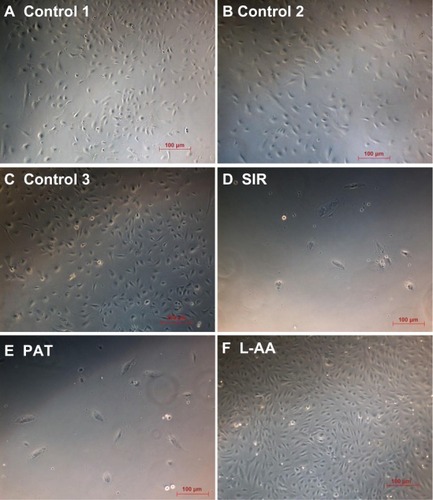
Figure 5 Immunofluorescence microscopy images of ECs for L-AA, SIR, PAT, and controls (A–F) (scale bar indicates 50 μm).
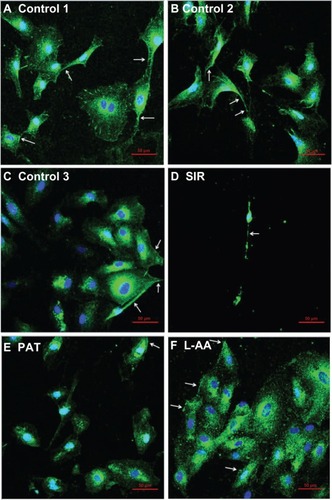
Figure 6 Endothelial cell viability and proliferation for the different doses of L-ascorbic acid.
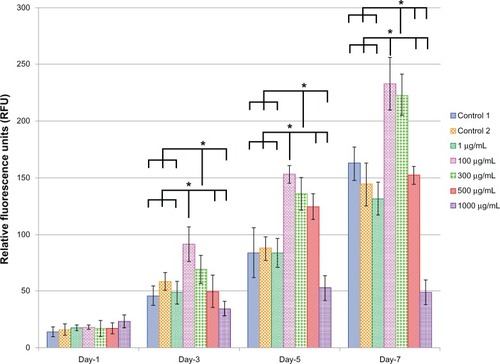
Figure 7 Fluorescence microscopy images of fluorescein diacetate-stained endothelial cells for the different doses of L-ascorbic acid (scale bar indicates 100 μm).
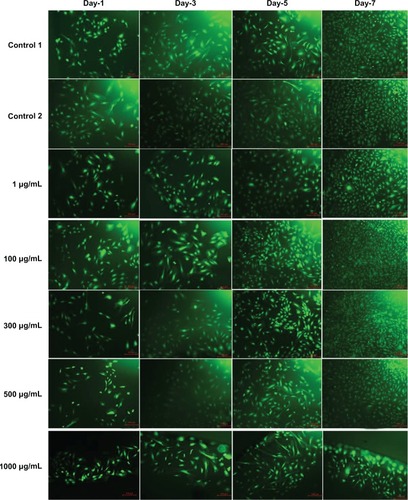
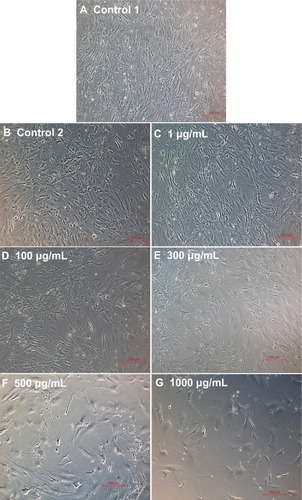
Figure 8 Phase contrast images of endothelial cells for the different doses of L-ascorbic acid (A–G)(scale bar indicates 100 μm).
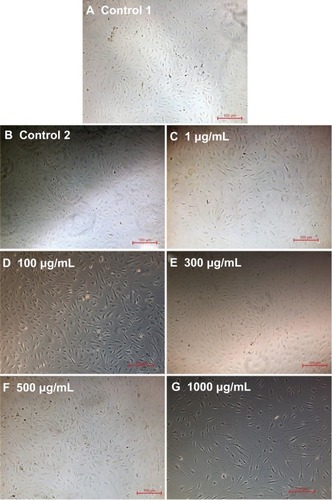
Figure 9 Immunofluorescence microscopy images of endothelial cells for different doses of L-AA (A–G) (scale bar indicates 50 μm).
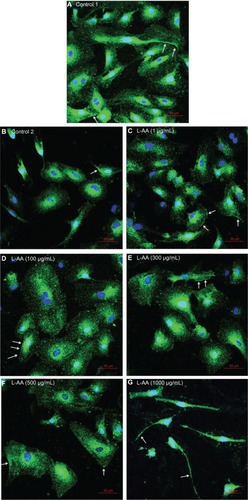
Figure 10 Smooth muscle cell viability and proliferation for L-AA, SIR, PAT, and controls.
Abbreviations: L-AA, L-ascorbic acid; PAT, paclitaxel; SIR, sirolimus.
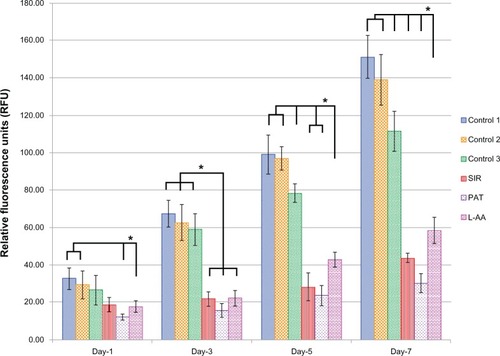
Figure 11 Fluorescence microscopy images of FDA stained SMCs for L-AA, SIR, PAT, and controls (scale bar indicates 100 μm).
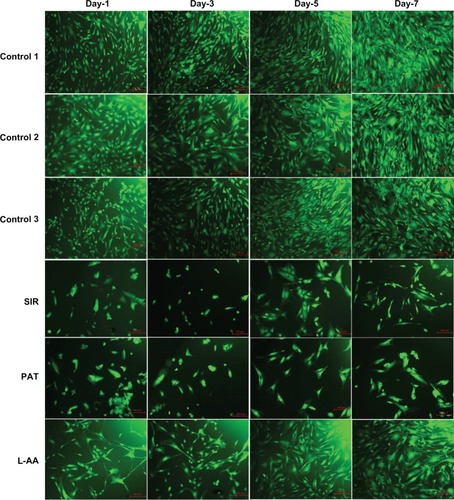
Figure 12 Phase contrast images of SMCs for L-AA, SIR, PAT, and controls (A–F) (scale bar indicates 100 μm).
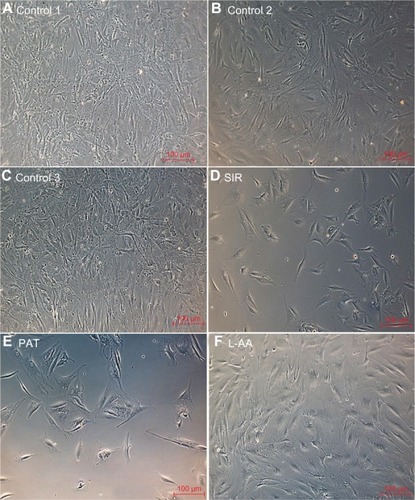
Figure 13 Smooth muscle cell viability and proliferation for the different doses of L-ascorbic acid.
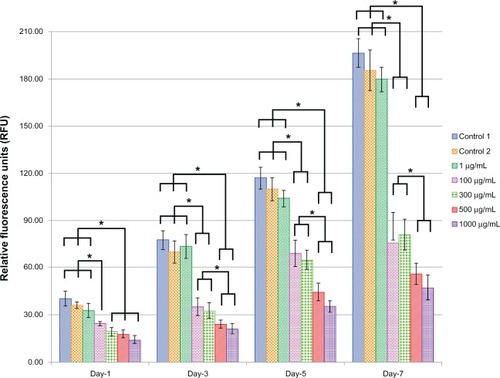
Figure 14 Fluorescence microscopy images of fluorescein diacetate-stained smooth muscle cells for the different doses of L-ascorbic acid (scale bar indicates 100 μm).
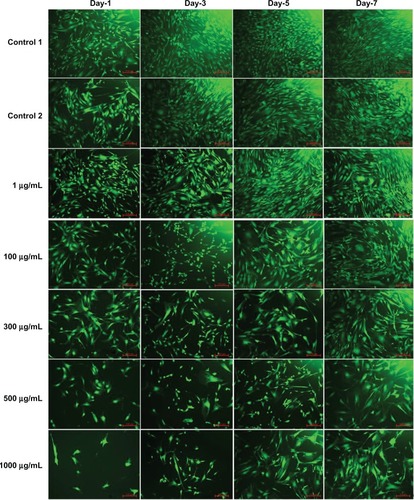
Figure 15 Phase contrast images of smooth muscle cells for the different doses of L-ascorbic acid (A–G) (scale bar indicates 100 μm).