
Figures & data
Table 1 Baseline Demographics and Clinical Characteristics of Enrolled Breast Cancer Patients
Table 2 Summary of the Pathologic Response
Figure 1 (A–C) Swimmer-style clinical follow-up plot detailing the clinical course of all enrolled patients in Cohort A–C. (D) Kaplan–Meier curves for progression-free survival for patients in Cohort A–C.
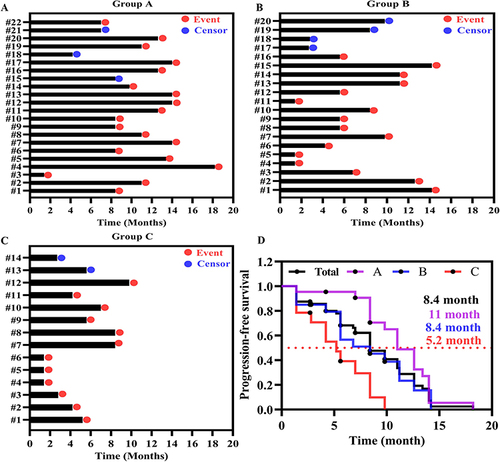
Figure 2 Overall QoL score (A), physical function score (B), emotional function score (C), and cognitive function score (D) of patients in Cohort A–C during treatment period.
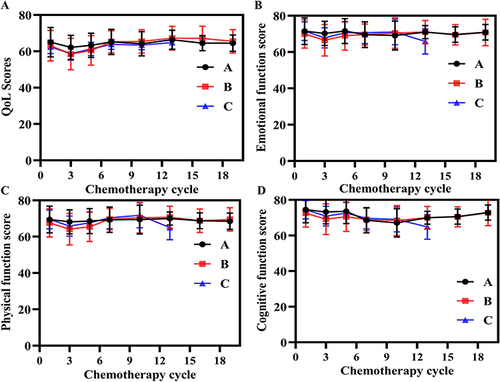
Table 3 Treatment- Related Adverse Events (TRAEs)
Data Sharing Statement
All data included in this study are available upon request by contact with the corresponding author.