Figures & data
Table 1 Baseline Characteristics of the 54 Patients Recruited. Values are the Mean (SD), Median (IQR [Range]) or Number (Proportion)
Figure 1 CONSORT diagram of patient recruitment.
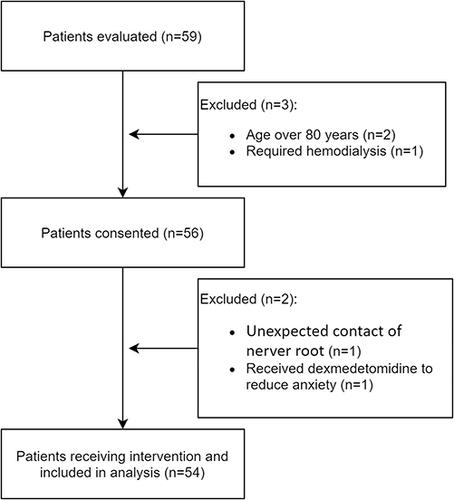
Table 2 The Number of Positive Responses, MLEs of the True Positive Rates and Adjusted Positive Rates Calculated by the PAVA for Each Concentration Level of Ropivacaine
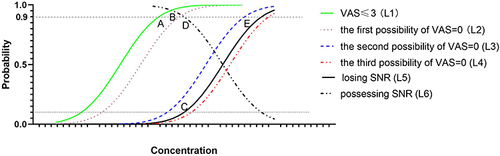
Figure 2 Responses of patients. The hollow circles indicate cases of negative response (possessing sensation of the nerve root), the solid circles indicate cases of positive response (losing sensation of the nerve root), and the diamonds indicate the cases dropped from the study. The black lines indicate the estimator of the 10% effective concentration (EC10) and the 95% CI. On the left side of the y-axis, the sample sizes are shown at different concentration levels, among which two levels (0.41% and 0.44%) account for a large majority of cases.
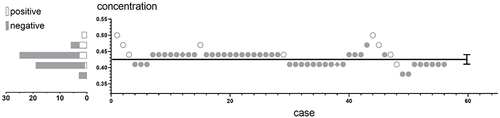
Figure 3 The curves of SNR loss and VAS=0. The possession of SNR (L6) as the target endpoint was replaced by the loss of SNR (L5), which is the real effect of local anaesthetics. (A) MLEs of true positive rates are plotted as red diamonds. The cumulative distribution function (CDF, blue line) and 95% CI (azure area) of SNR loss (L5) were obtained by probit regression. (B) The regression function (Orange line) and 95% CI (jade-green area) were obtained by probit regression to match the CDF of VAS=0 (L3).
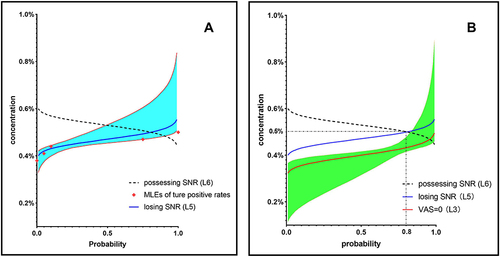
Table 3 The Number of VAS=0 and Instances of Each Statement of SNR for Each Concentration Level of Ropivacaine
Figure 4 Theoretical cumulative distribution functions (CDFs) at different endpoints based on pharmacodynamics. L1 is the CDF of VAS≤3, and point B indicates 90% of patients with VAS≤3 as the estimator for MEC. The CDF of VAS=0 may be L2, L3 or L4. L5 is the CDF of those losing SNR, and L6 is the probability curve of those possessing SNR. There is a correlation wherein L5 is symmetric with L6 and L5 = 1–L6; thus, the concentration at which 10% of patients lose SNR (point C) is the same as the concentration at which 90% of patients possess SNR (point D) as an estimator for theMTC. a) If the CDF of VAS=0 is L2 close to L1, the concentrations for both VAS≤3 among 90% of patients (point A) and VAS=0 among 90% of patients (point B) are lower than the MTC (point C). The effective concentration range (=MTC-MEC) of BC is more accurate than that of AC, and VAS=0 is a better clinical endpoint for MEC than VAS≤3. b) If the CDF of VAS=0 is L3 near and to the left of L5, where the concentration in 90% of patients with VAS=0 (point E) would be larger than the MTC (point C), AC can be adopted as the effective concentration range only. c) If the CDF of VAS=0 is close to L4 and to the right of L5, only AC can be adopted as the effective concentration range. Furthermore, the SNR is lost when VAS=0, such that sensation without pain is not realized.