Figures & data
Table 1 Patient Characteristics and Induction Data in the Groups
Figure 1 Flow diagram of included participants.
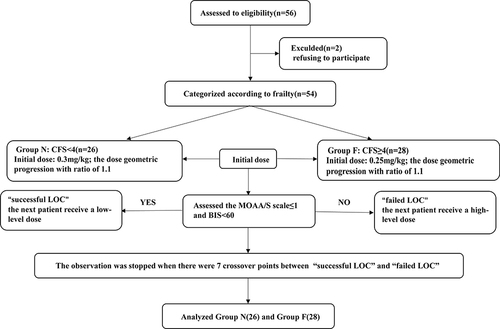
Table 2 ED50 and ED95 of Ciprofol for Anesthesia Induction
Figure 2 (A) The up-and-down sequence of ciprofol dose for loss of consciousness in Group N. The black dot represents “successful loc” and the white dot represents “failed loc”. (B) The up-and-down sequence of ciprofol dose for loss of consciousness in Group F. (C) Dose–response curve fitted to the Saidman and Eger data and used to generate the simulation data in Group N. Here a positive response is defined as the MOAA/S≤1 and BIS value<60. (D) Dose–response curve fitted to the Saidman and Eger data and used to generate the simulation data in Group F.
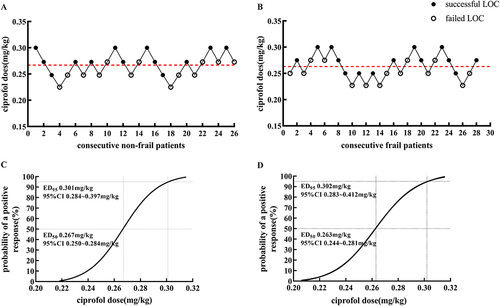
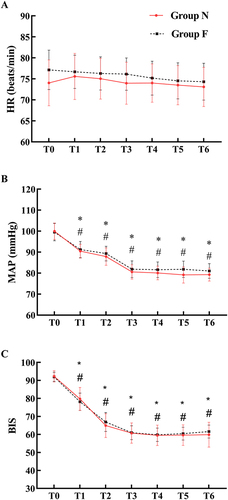
Figure 3 Hemodynamic parameters and BIS values during anesthesia induction. HR didn’t decrease (A), MAP decreased (B), BIS decreased (C) after bolus administration of ciprofol in the groups. Error bars represent 95% confidence interval.