
Figures & data
Table 1 Basic Characteristics of the Study Groups
Table 2 Comparison of Primary Outcomes
Table 3 Comparison of Adverse Effects
Table 4 Comparison of Follow-Up Questionnaires Before Discharge
Table 5 Comparison of Follow-Up Telephone Questionnaire 24-Hour After Procedure
Figure 1 Study design: summary of inclusion and exclusion criteria of study population.
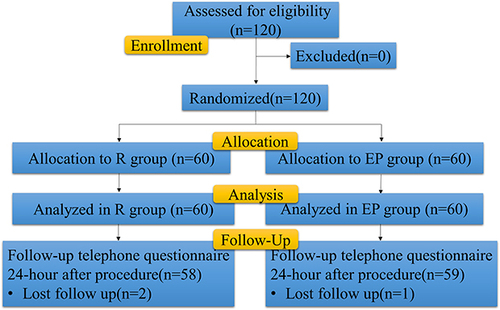
Figure 2 Comparison of MOAA/S score. The MOAA/S score of the R group was higher than that of the EP group at first 2min after administration (P< 0.05).
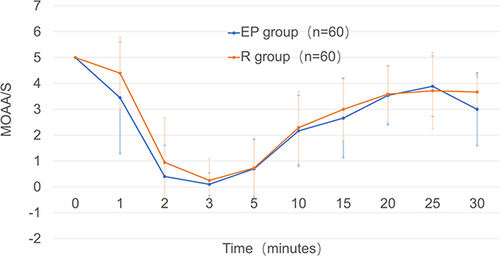
Figure 3 Comparison of SpO2 and PetCO2. There was no significant difference in SPO2 between the two groups at each time point (P>0.05). Compared with the baseline value T0, PetCO2 decreased within 1–10 min after the first dose in both groups (P <0.05) and decreased to the lowest level approximately 3 min after administration.
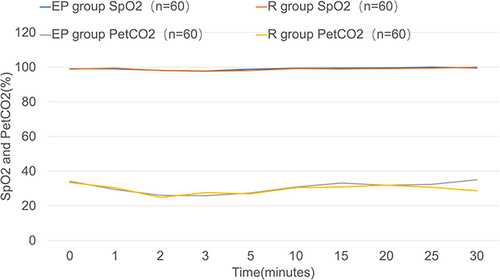
Figure 4 Comparison of respiratory rates. In both groups, respiratory rates decreased from 1 to 5 min after administration of the drug compared with baseline. It then returned to baseline levels. The RR was lower in the EP group than in the R group at 3 min after administration (P<0.05).
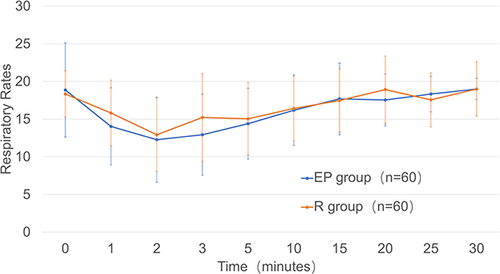
Figure 5 Comparison of heart rates. The heart rate of group R was higher than that of group EP at 2, 3 and 5 min after administration (P < 0.05).
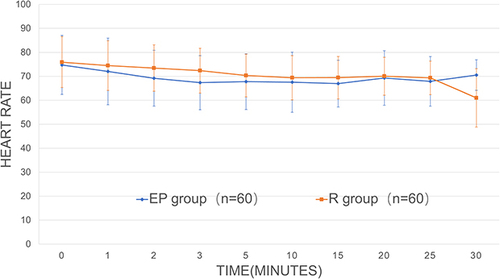
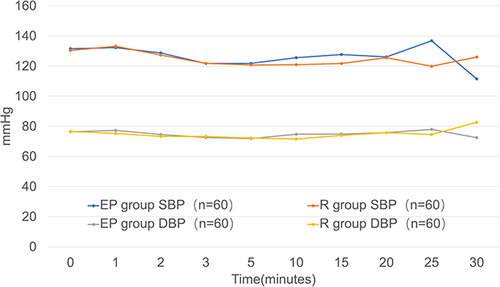
Figure 6 Comparison of blood pressure. Systolic blood pressure in EP group was higher than that in R group at 15 min and 25 min after administration (P < 0.05). There was no significant difference in diastolic blood pressure between the two groups (P>0.05).
Data Sharing Statement
The datasets generated and/or analyzed during the current study are not publicly available, but are available from the corresponding author upon reasonable request.